Soviet Union vs Immigrants from Nigeria Male Disability
COMPARE
Soviet Union
Immigrants from Nigeria
Male Disability
Male Disability Comparison
Soviet Union
Immigrants from Nigeria
10.1%
MALE DISABILITY
99.9/ 100
METRIC RATING
31st/ 347
METRIC RANK
10.8%
MALE DISABILITY
95.1/ 100
METRIC RATING
104th/ 347
METRIC RANK
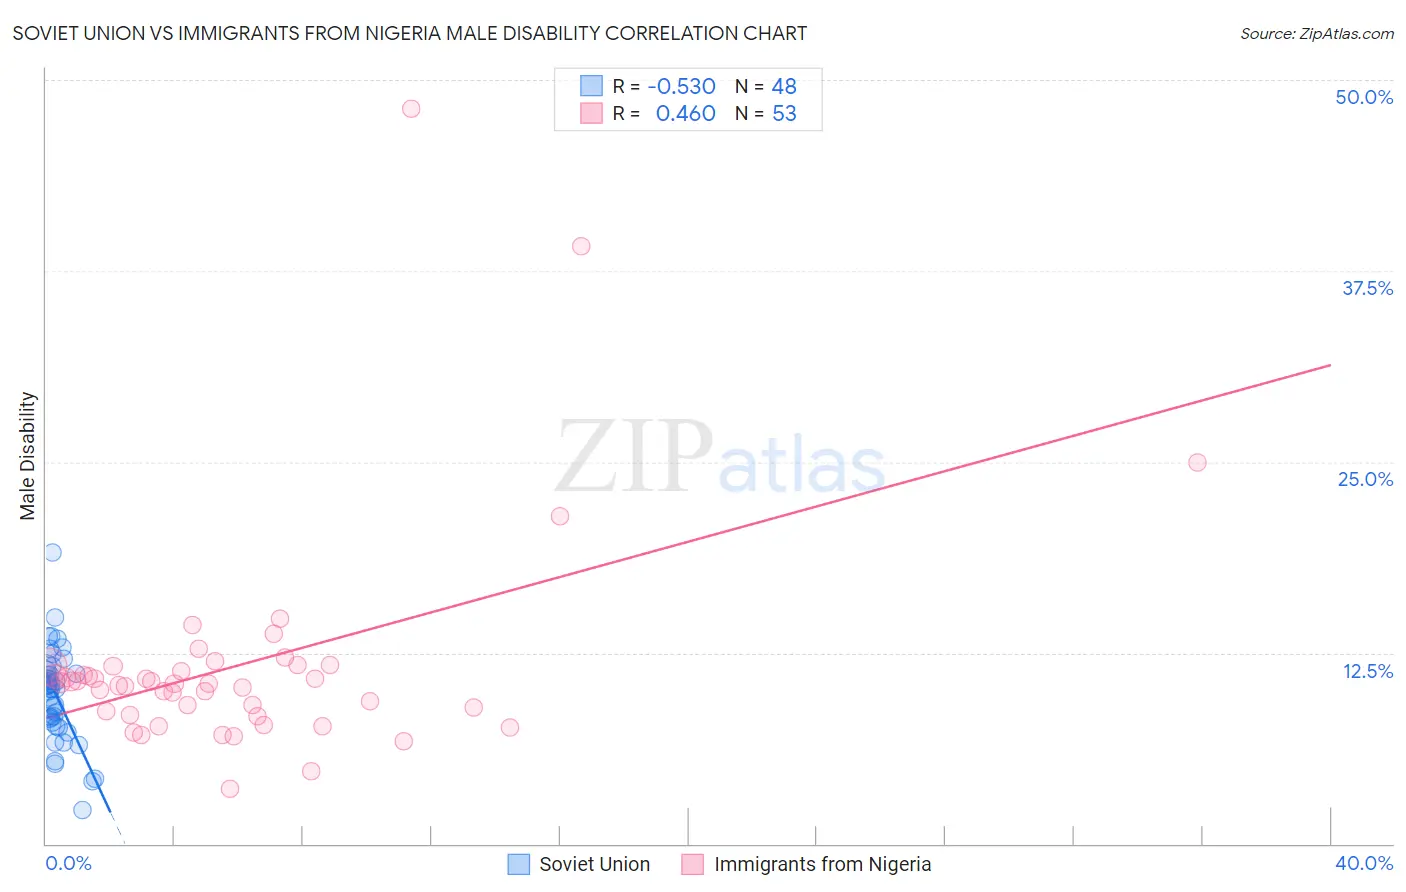
Soviet Union vs Immigrants from Nigeria Male Disability Correlation Chart
The statistical analysis conducted on geographies consisting of 43,487,843 people shows a substantial negative correlation between the proportion of Soviet Union and percentage of males with a disability in the United States with a correlation coefficient (R) of -0.530 and weighted average of 10.1%. Similarly, the statistical analysis conducted on geographies consisting of 283,467,451 people shows a moderate positive correlation between the proportion of Immigrants from Nigeria and percentage of males with a disability in the United States with a correlation coefficient (R) of 0.460 and weighted average of 10.8%, a difference of 6.3%.
Male Disability Correlation Summary
| Measurement | Soviet Union | Immigrants from Nigeria |
| Minimum | 2.2% | 3.6% |
| Maximum | 19.1% | 48.1% |
| Range | 16.9% | 44.5% |
| Mean | 9.8% | 11.7% |
| Median | 10.2% | 10.5% |
| Interquartile 25% (IQ1) | 8.0% | 8.5% |
| Interquartile 75% (IQ3) | 11.2% | 11.6% |
| Interquartile Range (IQR) | 3.2% | 3.1% |
| Standard Deviation (Sample) | 3.0% | 7.3% |
| Standard Deviation (Population) | 3.0% | 7.2% |
Similar Demographics by Male Disability
Demographics Similar to Soviet Union by Male Disability
In terms of male disability, the demographic groups most similar to Soviet Union are Immigrants from Egypt (10.1%, a difference of 0.070%), Venezuelan (10.1%, a difference of 0.10%), Argentinean (10.1%, a difference of 0.15%), Vietnamese (10.1%, a difference of 0.26%), and Egyptian (10.1%, a difference of 0.28%).
| Demographics | Rating | Rank | Male Disability |
| Immigrants | Asia | 100.0 /100 | #24 | Exceptional 10.0% |
| Immigrants | Malaysia | 99.9 /100 | #25 | Exceptional 10.0% |
| Paraguayans | 99.9 /100 | #26 | Exceptional 10.1% |
| Egyptians | 99.9 /100 | #27 | Exceptional 10.1% |
| Vietnamese | 99.9 /100 | #28 | Exceptional 10.1% |
| Venezuelans | 99.9 /100 | #29 | Exceptional 10.1% |
| Immigrants | Egypt | 99.9 /100 | #30 | Exceptional 10.1% |
| Soviet Union | 99.9 /100 | #31 | Exceptional 10.1% |
| Argentineans | 99.9 /100 | #32 | Exceptional 10.1% |
| Immigrants | Ethiopia | 99.9 /100 | #33 | Exceptional 10.2% |
| Immigrants | Turkey | 99.9 /100 | #34 | Exceptional 10.2% |
| Immigrants | Argentina | 99.9 /100 | #35 | Exceptional 10.2% |
| Ethiopians | 99.8 /100 | #36 | Exceptional 10.2% |
| Immigrants | Indonesia | 99.8 /100 | #37 | Exceptional 10.2% |
| Immigrants | Kuwait | 99.8 /100 | #38 | Exceptional 10.2% |
Demographics Similar to Immigrants from Nigeria by Male Disability
In terms of male disability, the demographic groups most similar to Immigrants from Nigeria are Immigrants from Brazil (10.8%, a difference of 0.010%), Uruguayan (10.7%, a difference of 0.060%), Immigrants from Syria (10.8%, a difference of 0.060%), Immigrants from Eastern Europe (10.7%, a difference of 0.080%), and Immigrants from Greece (10.7%, a difference of 0.17%).
| Demographics | Rating | Rank | Male Disability |
| Immigrants | Armenia | 96.6 /100 | #97 | Exceptional 10.7% |
| Immigrants | Romania | 96.5 /100 | #98 | Exceptional 10.7% |
| Immigrants | Switzerland | 96.1 /100 | #99 | Exceptional 10.7% |
| Immigrants | Kazakhstan | 95.9 /100 | #100 | Exceptional 10.7% |
| Immigrants | Greece | 95.6 /100 | #101 | Exceptional 10.7% |
| Immigrants | Eastern Europe | 95.3 /100 | #102 | Exceptional 10.7% |
| Uruguayans | 95.3 /100 | #103 | Exceptional 10.7% |
| Immigrants | Nigeria | 95.1 /100 | #104 | Exceptional 10.8% |
| Immigrants | Brazil | 95.0 /100 | #105 | Exceptional 10.8% |
| Immigrants | Syria | 94.9 /100 | #106 | Exceptional 10.8% |
| Immigrants | Eastern Africa | 94.3 /100 | #107 | Exceptional 10.8% |
| Immigrants | Belgium | 94.2 /100 | #108 | Exceptional 10.8% |
| Immigrants | Uganda | 94.0 /100 | #109 | Exceptional 10.8% |
| Immigrants | Immigrants | 93.9 /100 | #110 | Exceptional 10.8% |
| Immigrants | Uruguay | 93.8 /100 | #111 | Exceptional 10.8% |