Soviet Union vs Immigrants from Morocco Nursery School
COMPARE
Soviet Union
Immigrants from Morocco
Nursery School
Nursery School Comparison
Soviet Union
Immigrants from Morocco
98.0%
NURSERY SCHOOL
71.6/ 100
METRIC RATING
151st/ 347
METRIC RANK
97.8%
NURSERY SCHOOL
5.1/ 100
METRIC RATING
219th/ 347
METRIC RANK
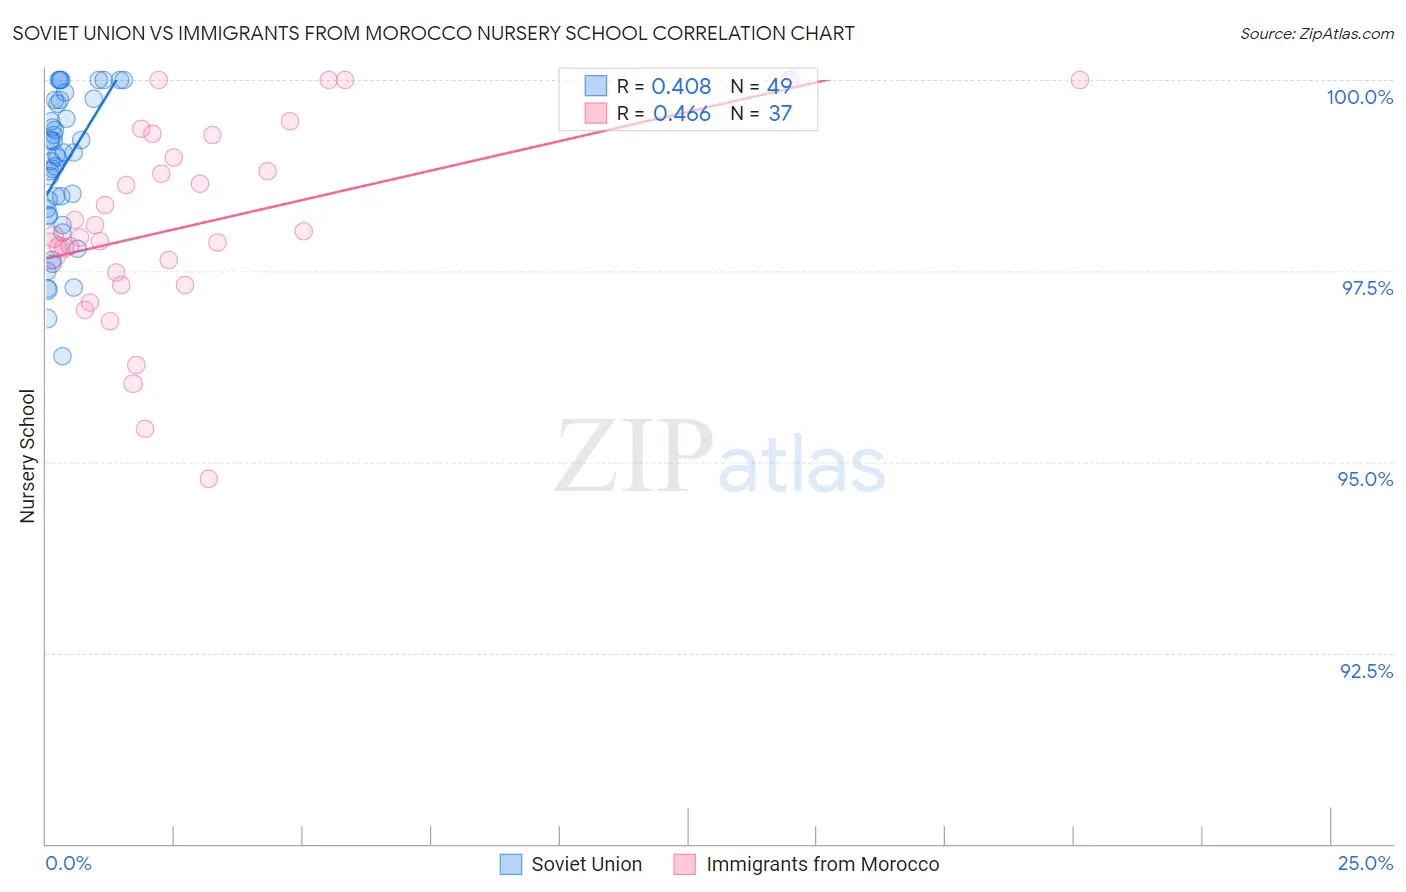
Soviet Union vs Immigrants from Morocco Nursery School Correlation Chart
The statistical analysis conducted on geographies consisting of 43,454,395 people shows a moderate positive correlation between the proportion of Soviet Union and percentage of population with at least nursery school education in the United States with a correlation coefficient (R) of 0.408 and weighted average of 98.0%. Similarly, the statistical analysis conducted on geographies consisting of 178,912,438 people shows a moderate positive correlation between the proportion of Immigrants from Morocco and percentage of population with at least nursery school education in the United States with a correlation coefficient (R) of 0.466 and weighted average of 97.8%, a difference of 0.29%.
Nursery School Correlation Summary
| Measurement | Soviet Union | Immigrants from Morocco |
| Minimum | 96.4% | 94.8% |
| Maximum | 100.0% | 100.0% |
| Range | 3.6% | 5.2% |
| Mean | 98.8% | 98.1% |
| Median | 99.0% | 98.0% |
| Interquartile 25% (IQ1) | 98.2% | 97.4% |
| Interquartile 75% (IQ3) | 99.7% | 99.1% |
| Interquartile Range (IQR) | 1.5% | 1.7% |
| Standard Deviation (Sample) | 0.95% | 1.3% |
| Standard Deviation (Population) | 0.94% | 1.3% |
Similar Demographics by Nursery School
Demographics Similar to Soviet Union by Nursery School
In terms of nursery school, the demographic groups most similar to Soviet Union are Jordanian (98.1%, a difference of 0.0%), Immigrants from Greece (98.1%, a difference of 0.010%), Apache (98.1%, a difference of 0.010%), Dutch West Indian (98.0%, a difference of 0.010%), and Immigrants from Moldova (98.0%, a difference of 0.010%).
| Demographics | Rating | Rank | Nursery School |
| Alsatians | 80.3 /100 | #144 | Excellent 98.1% |
| Immigrants | Israel | 78.5 /100 | #145 | Good 98.1% |
| Filipinos | 78.5 /100 | #146 | Good 98.1% |
| Hmong | 75.7 /100 | #147 | Good 98.1% |
| Immigrants | Greece | 75.4 /100 | #148 | Good 98.1% |
| Apache | 73.2 /100 | #149 | Good 98.1% |
| Jordanians | 72.9 /100 | #150 | Good 98.1% |
| Soviet Union | 71.6 /100 | #151 | Good 98.0% |
| Dutch West Indians | 70.2 /100 | #152 | Good 98.0% |
| Immigrants | Moldova | 69.6 /100 | #153 | Good 98.0% |
| Immigrants | Iran | 68.7 /100 | #154 | Good 98.0% |
| Immigrants | South Central Asia | 66.7 /100 | #155 | Good 98.0% |
| Venezuelans | 66.6 /100 | #156 | Good 98.0% |
| Comanche | 66.0 /100 | #157 | Good 98.0% |
| Immigrants | North Macedonia | 65.7 /100 | #158 | Good 98.0% |
Demographics Similar to Immigrants from Morocco by Nursery School
In terms of nursery school, the demographic groups most similar to Immigrants from Morocco are Immigrants from Panama (97.8%, a difference of 0.0%), Immigrants from Zaire (97.8%, a difference of 0.010%), Tongan (97.8%, a difference of 0.010%), Samoan (97.8%, a difference of 0.020%), and Immigrants from Syria (97.7%, a difference of 0.020%).
| Demographics | Rating | Rank | Nursery School |
| Immigrants | Bahamas | 8.6 /100 | #212 | Tragic 97.8% |
| Moroccans | 8.3 /100 | #213 | Tragic 97.8% |
| South American Indians | 8.0 /100 | #214 | Tragic 97.8% |
| Bahamians | 7.4 /100 | #215 | Tragic 97.8% |
| Uruguayans | 7.1 /100 | #216 | Tragic 97.8% |
| Samoans | 6.3 /100 | #217 | Tragic 97.8% |
| Immigrants | Panama | 5.3 /100 | #218 | Tragic 97.8% |
| Immigrants | Morocco | 5.1 /100 | #219 | Tragic 97.8% |
| Immigrants | Zaire | 4.4 /100 | #220 | Tragic 97.8% |
| Tongans | 4.3 /100 | #221 | Tragic 97.8% |
| Immigrants | Syria | 4.0 /100 | #222 | Tragic 97.7% |
| Immigrants | Sudan | 3.9 /100 | #223 | Tragic 97.7% |
| Immigrants | Nepal | 3.6 /100 | #224 | Tragic 97.7% |
| Immigrants | Costa Rica | 3.5 /100 | #225 | Tragic 97.7% |
| Iraqis | 3.5 /100 | #226 | Tragic 97.7% |