Soviet Union vs Immigrants from Egypt Male Poverty
COMPARE
Soviet Union
Immigrants from Egypt
Male Poverty
Male Poverty Comparison
Soviet Union
Immigrants from Egypt
11.1%
MALE POVERTY
60.3/ 100
METRIC RATING
160th/ 347
METRIC RANK
10.4%
MALE POVERTY
93.7/ 100
METRIC RATING
96th/ 347
METRIC RANK
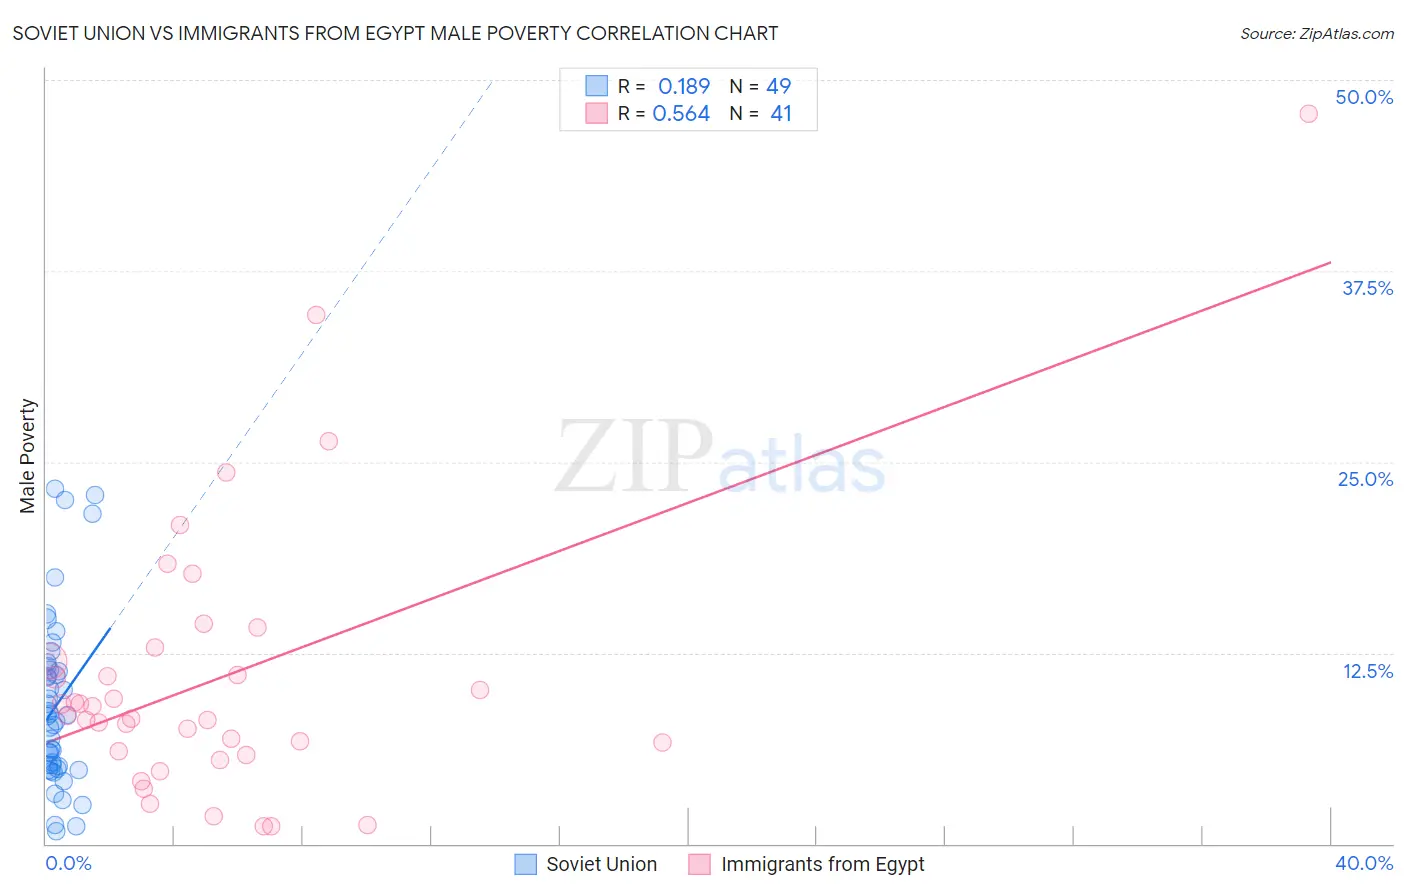
Soviet Union vs Immigrants from Egypt Male Poverty Correlation Chart
The statistical analysis conducted on geographies consisting of 43,503,005 people shows a poor positive correlation between the proportion of Soviet Union and poverty level among males in the United States with a correlation coefficient (R) of 0.189 and weighted average of 11.1%. Similarly, the statistical analysis conducted on geographies consisting of 245,353,400 people shows a substantial positive correlation between the proportion of Immigrants from Egypt and poverty level among males in the United States with a correlation coefficient (R) of 0.564 and weighted average of 10.4%, a difference of 6.0%.
Male Poverty Correlation Summary
| Measurement | Soviet Union | Immigrants from Egypt |
| Minimum | 0.80% | 1.1% |
| Maximum | 23.2% | 47.8% |
| Range | 22.4% | 46.7% |
| Mean | 9.1% | 10.9% |
| Median | 8.4% | 8.4% |
| Interquartile 25% (IQ1) | 5.0% | 5.9% |
| Interquartile 75% (IQ3) | 11.5% | 12.4% |
| Interquartile Range (IQR) | 6.4% | 6.5% |
| Standard Deviation (Sample) | 5.6% | 9.2% |
| Standard Deviation (Population) | 5.5% | 9.0% |
Similar Demographics by Male Poverty
Demographics Similar to Soviet Union by Male Poverty
In terms of male poverty, the demographic groups most similar to Soviet Union are Immigrants from Northern Africa (11.1%, a difference of 0.070%), Taiwanese (11.0%, a difference of 0.25%), Colombian (11.0%, a difference of 0.28%), Immigrants from Chile (11.1%, a difference of 0.30%), and Scotch-Irish (11.0%, a difference of 0.35%).
| Demographics | Rating | Rank | Male Poverty |
| Immigrants | Bosnia and Herzegovina | 65.2 /100 | #153 | Good 11.0% |
| Immigrants | Kazakhstan | 64.8 /100 | #154 | Good 11.0% |
| Immigrants | Malaysia | 64.7 /100 | #155 | Good 11.0% |
| Costa Ricans | 63.9 /100 | #156 | Good 11.0% |
| Scotch-Irish | 63.7 /100 | #157 | Good 11.0% |
| Colombians | 63.0 /100 | #158 | Good 11.0% |
| Taiwanese | 62.7 /100 | #159 | Good 11.0% |
| Soviet Union | 60.3 /100 | #160 | Good 11.1% |
| Immigrants | Northern Africa | 59.7 /100 | #161 | Average 11.1% |
| Immigrants | Chile | 57.4 /100 | #162 | Average 11.1% |
| Whites/Caucasians | 56.7 /100 | #163 | Average 11.1% |
| Ethiopians | 56.7 /100 | #164 | Average 11.1% |
| Immigrants | Spain | 55.5 /100 | #165 | Average 11.1% |
| Immigrants | Albania | 55.3 /100 | #166 | Average 11.1% |
| Hungarians | 55.1 /100 | #167 | Average 11.1% |
Demographics Similar to Immigrants from Egypt by Male Poverty
In terms of male poverty, the demographic groups most similar to Immigrants from Egypt are Romanian (10.5%, a difference of 0.050%), Finnish (10.5%, a difference of 0.11%), Scottish (10.4%, a difference of 0.13%), Immigrants from South Africa (10.4%, a difference of 0.16%), and Immigrants from Indonesia (10.5%, a difference of 0.18%).
| Demographics | Rating | Rank | Male Poverty |
| Immigrants | Denmark | 95.0 /100 | #89 | Exceptional 10.4% |
| Indians (Asian) | 94.9 /100 | #90 | Exceptional 10.4% |
| British | 94.8 /100 | #91 | Exceptional 10.4% |
| Jordanians | 94.4 /100 | #92 | Exceptional 10.4% |
| Australians | 94.4 /100 | #93 | Exceptional 10.4% |
| Immigrants | South Africa | 94.1 /100 | #94 | Exceptional 10.4% |
| Scottish | 94.0 /100 | #95 | Exceptional 10.4% |
| Immigrants | Egypt | 93.7 /100 | #96 | Exceptional 10.4% |
| Romanians | 93.6 /100 | #97 | Exceptional 10.5% |
| Finns | 93.4 /100 | #98 | Exceptional 10.5% |
| Immigrants | Indonesia | 93.3 /100 | #99 | Exceptional 10.5% |
| Immigrants | Latvia | 92.8 /100 | #100 | Exceptional 10.5% |
| Immigrants | Zimbabwe | 92.0 /100 | #101 | Exceptional 10.5% |
| French Canadians | 91.9 /100 | #102 | Exceptional 10.5% |
| Slavs | 91.7 /100 | #103 | Exceptional 10.5% |