Soviet Union vs Immigrants from Morocco Unemployment Among Women with Children Ages 6 to 17 years
COMPARE
Soviet Union
Immigrants from Morocco
Unemployment Among Women with Children Ages 6 to 17 years
Unemployment Among Women with Children Ages 6 to 17 years Comparison
Soviet Union
Immigrants from Morocco
7.1%
UNEMPLOYMENT AMONG WOMEN WITH CHILDREN AGES 6 TO 17 YEARS
100.0/ 100
METRIC RATING
7th/ 347
METRIC RANK
8.7%
UNEMPLOYMENT AMONG WOMEN WITH CHILDREN AGES 6 TO 17 YEARS
94.9/ 100
METRIC RATING
123rd/ 347
METRIC RANK
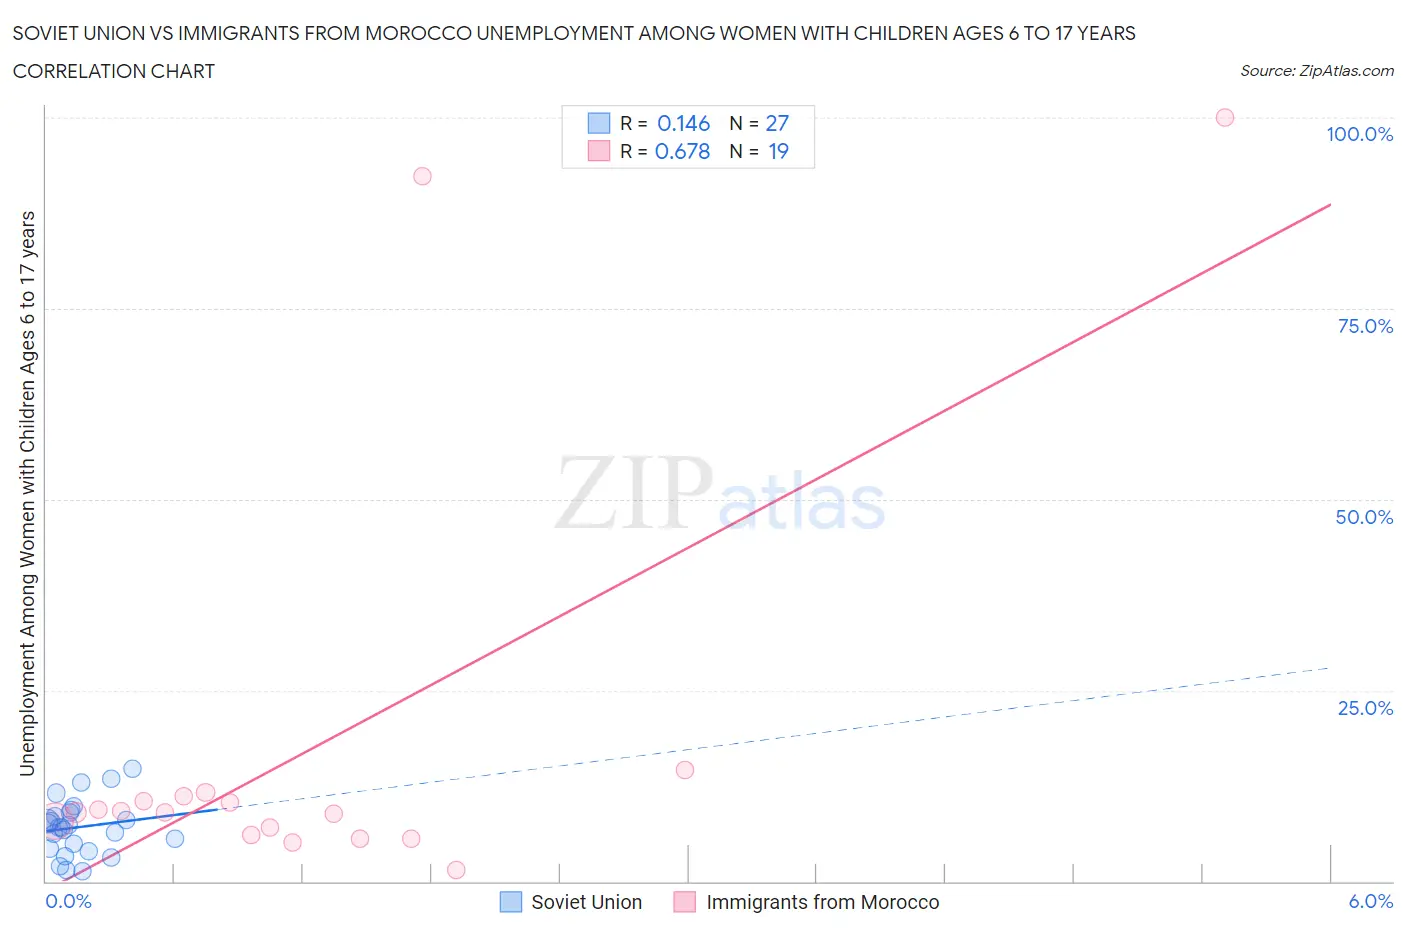
Soviet Union vs Immigrants from Morocco Unemployment Among Women with Children Ages 6 to 17 years Correlation Chart
The statistical analysis conducted on geographies consisting of 40,907,695 people shows a poor positive correlation between the proportion of Soviet Union and unemployment rate among women with children between the ages 6 and 17 in the United States with a correlation coefficient (R) of 0.146 and weighted average of 7.1%. Similarly, the statistical analysis conducted on geographies consisting of 147,990,397 people shows a significant positive correlation between the proportion of Immigrants from Morocco and unemployment rate among women with children between the ages 6 and 17 in the United States with a correlation coefficient (R) of 0.678 and weighted average of 8.7%, a difference of 22.4%.
Unemployment Among Women with Children Ages 6 to 17 years Correlation Summary
| Measurement | Soviet Union | Immigrants from Morocco |
| Minimum | 1.3% | 1.4% |
| Maximum | 14.8% | 100.0% |
| Range | 13.5% | 98.6% |
| Mean | 7.1% | 17.6% |
| Median | 7.0% | 9.1% |
| Interquartile 25% (IQ1) | 4.3% | 6.0% |
| Interquartile 75% (IQ3) | 9.0% | 11.1% |
| Interquartile Range (IQR) | 4.7% | 5.1% |
| Standard Deviation (Sample) | 3.5% | 27.9% |
| Standard Deviation (Population) | 3.5% | 27.1% |
Similar Demographics by Unemployment Among Women with Children Ages 6 to 17 years
Demographics Similar to Soviet Union by Unemployment Among Women with Children Ages 6 to 17 years
In terms of unemployment among women with children ages 6 to 17 years, the demographic groups most similar to Soviet Union are Tlingit-Haida (7.1%, a difference of 0.060%), Okinawan (7.0%, a difference of 0.53%), Ute (7.0%, a difference of 1.1%), Immigrants from Hong Kong (7.2%, a difference of 1.4%), and Assyrian/Chaldean/Syriac (7.2%, a difference of 1.7%).
| Demographics | Rating | Rank | Unemployment Among Women with Children Ages 6 to 17 years |
| Taiwanese | 100.0 /100 | #1 | Exceptional 6.5% |
| Fijians | 100.0 /100 | #2 | Exceptional 6.6% |
| Tongans | 100.0 /100 | #3 | Exceptional 6.7% |
| Ute | 100.0 /100 | #4 | Exceptional 7.0% |
| Okinawans | 100.0 /100 | #5 | Exceptional 7.0% |
| Tlingit-Haida | 100.0 /100 | #6 | Exceptional 7.1% |
| Soviet Union | 100.0 /100 | #7 | Exceptional 7.1% |
| Immigrants | Hong Kong | 100.0 /100 | #8 | Exceptional 7.2% |
| Assyrians/Chaldeans/Syriacs | 100.0 /100 | #9 | Exceptional 7.2% |
| Immigrants | Fiji | 100.0 /100 | #10 | Exceptional 7.3% |
| Immigrants | Taiwan | 100.0 /100 | #11 | Exceptional 7.3% |
| Bangladeshis | 100.0 /100 | #12 | Exceptional 7.4% |
| Indonesians | 100.0 /100 | #13 | Exceptional 7.4% |
| Sudanese | 100.0 /100 | #14 | Exceptional 7.4% |
| Puget Sound Salish | 100.0 /100 | #15 | Exceptional 7.5% |
Demographics Similar to Immigrants from Morocco by Unemployment Among Women with Children Ages 6 to 17 years
In terms of unemployment among women with children ages 6 to 17 years, the demographic groups most similar to Immigrants from Morocco are Immigrants from Lebanon (8.7%, a difference of 0.0%), Immigrants from Egypt (8.7%, a difference of 0.040%), South African (8.7%, a difference of 0.070%), Immigrants from Northern Africa (8.7%, a difference of 0.10%), and Czech (8.7%, a difference of 0.10%).
| Demographics | Rating | Rank | Unemployment Among Women with Children Ages 6 to 17 years |
| Zimbabweans | 96.3 /100 | #116 | Exceptional 8.6% |
| Albanians | 96.3 /100 | #117 | Exceptional 8.6% |
| Pueblo | 96.2 /100 | #118 | Exceptional 8.6% |
| Immigrants | Grenada | 96.2 /100 | #119 | Exceptional 8.6% |
| Israelis | 95.9 /100 | #120 | Exceptional 8.7% |
| Immigrants | Denmark | 95.5 /100 | #121 | Exceptional 8.7% |
| Immigrants | Egypt | 95.0 /100 | #122 | Exceptional 8.7% |
| Immigrants | Morocco | 94.9 /100 | #123 | Exceptional 8.7% |
| Immigrants | Lebanon | 94.9 /100 | #124 | Exceptional 8.7% |
| South Africans | 94.6 /100 | #125 | Exceptional 8.7% |
| Immigrants | Northern Africa | 94.4 /100 | #126 | Exceptional 8.7% |
| Czechs | 94.4 /100 | #127 | Exceptional 8.7% |
| Hmong | 94.3 /100 | #128 | Exceptional 8.7% |
| Barbadians | 93.8 /100 | #129 | Exceptional 8.7% |
| Immigrants | Western Asia | 93.1 /100 | #130 | Exceptional 8.7% |