Soviet Union vs Immigrants from Scotland Poverty
COMPARE
Soviet Union
Immigrants from Scotland
Poverty
Poverty Comparison
Soviet Union
Immigrants from Scotland
11.7%
POVERTY
88.4/ 100
METRIC RATING
124th/ 347
METRIC RANK
10.6%
POVERTY
99.7/ 100
METRIC RATING
19th/ 347
METRIC RANK
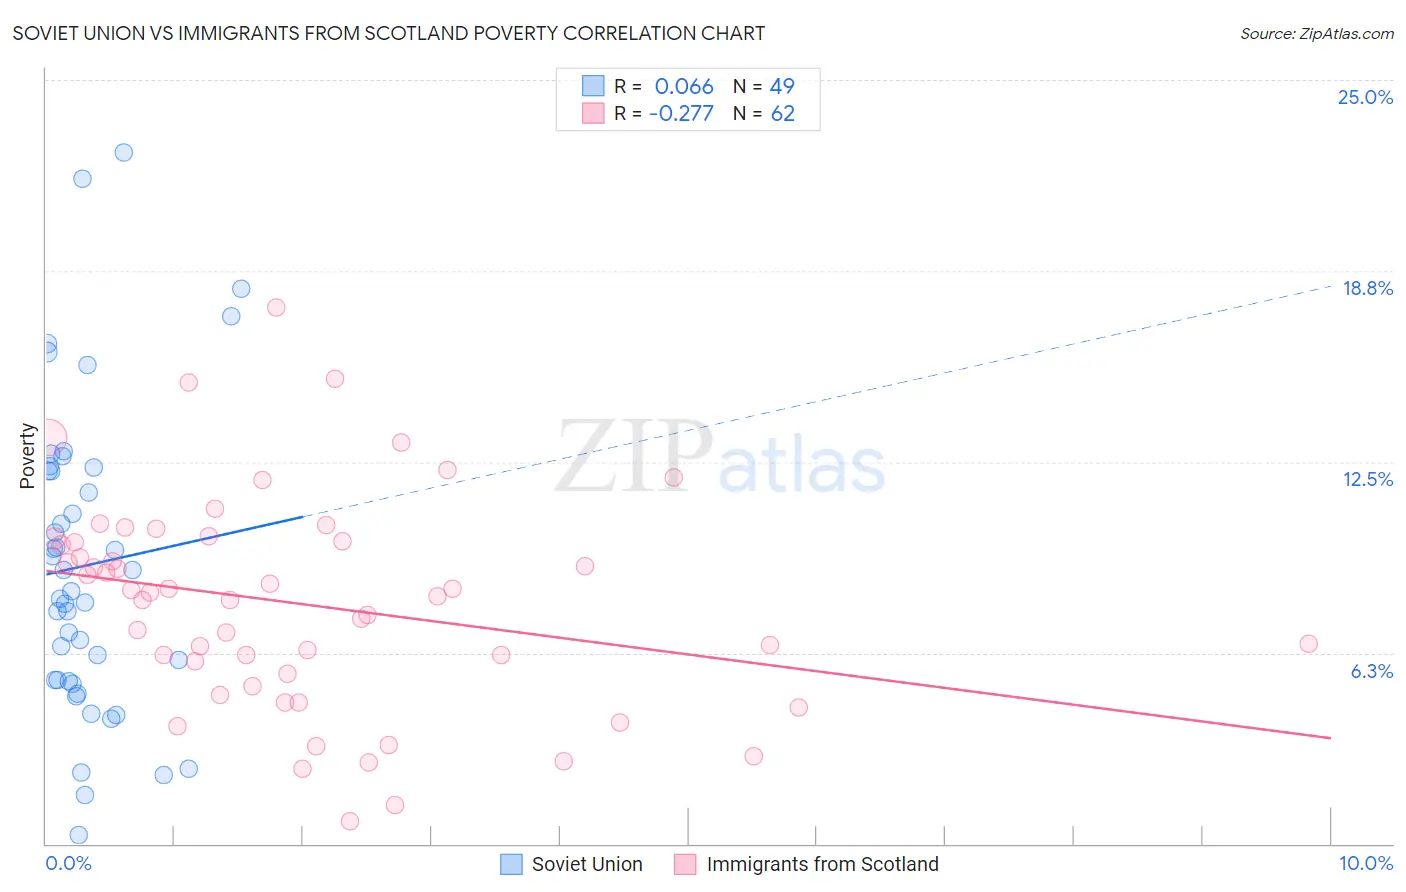
Soviet Union vs Immigrants from Scotland Poverty Correlation Chart
The statistical analysis conducted on geographies consisting of 43,449,399 people shows a slight positive correlation between the proportion of Soviet Union and poverty level in the United States with a correlation coefficient (R) of 0.066 and weighted average of 11.7%. Similarly, the statistical analysis conducted on geographies consisting of 196,384,756 people shows a weak negative correlation between the proportion of Immigrants from Scotland and poverty level in the United States with a correlation coefficient (R) of -0.277 and weighted average of 10.6%, a difference of 10.9%.
Poverty Correlation Summary
| Measurement | Soviet Union | Immigrants from Scotland |
| Minimum | 0.29% | 0.74% |
| Maximum | 22.6% | 17.6% |
| Range | 22.3% | 16.8% |
| Mean | 9.1% | 7.8% |
| Median | 8.3% | 8.2% |
| Interquartile 25% (IQ1) | 5.3% | 5.6% |
| Interquartile 75% (IQ3) | 12.3% | 9.9% |
| Interquartile Range (IQR) | 6.9% | 4.4% |
| Standard Deviation (Sample) | 5.0% | 3.5% |
| Standard Deviation (Population) | 5.0% | 3.4% |
Similar Demographics by Poverty
Demographics Similar to Soviet Union by Poverty
In terms of poverty, the demographic groups most similar to Soviet Union are Immigrants from Brazil (11.7%, a difference of 0.040%), Immigrants from Hungary (11.7%, a difference of 0.070%), Immigrants from Norway (11.7%, a difference of 0.080%), New Zealander (11.7%, a difference of 0.090%), and Puget Sound Salish (11.7%, a difference of 0.090%).
| Demographics | Rating | Rank | Poverty |
| Sri Lankans | 89.4 /100 | #117 | Excellent 11.7% |
| Argentineans | 89.1 /100 | #118 | Excellent 11.7% |
| Tlingit-Haida | 89.0 /100 | #119 | Excellent 11.7% |
| Immigrants | South Eastern Asia | 88.9 /100 | #120 | Excellent 11.7% |
| New Zealanders | 88.7 /100 | #121 | Excellent 11.7% |
| Puget Sound Salish | 88.7 /100 | #122 | Excellent 11.7% |
| Immigrants | Hungary | 88.6 /100 | #123 | Excellent 11.7% |
| Soviet Union | 88.4 /100 | #124 | Excellent 11.7% |
| Immigrants | Brazil | 88.2 /100 | #125 | Excellent 11.7% |
| Immigrants | Norway | 88.0 /100 | #126 | Excellent 11.7% |
| Immigrants | Argentina | 88.0 /100 | #127 | Excellent 11.7% |
| Immigrants | Israel | 87.4 /100 | #128 | Excellent 11.7% |
| South Africans | 87.0 /100 | #129 | Excellent 11.7% |
| Immigrants | Ukraine | 86.6 /100 | #130 | Excellent 11.8% |
| French | 86.1 /100 | #131 | Excellent 11.8% |
Demographics Similar to Immigrants from Scotland by Poverty
In terms of poverty, the demographic groups most similar to Immigrants from Scotland are Immigrants from North Macedonia (10.6%, a difference of 0.11%), Luxembourger (10.6%, a difference of 0.19%), Eastern European (10.6%, a difference of 0.35%), Latvian (10.5%, a difference of 0.39%), and Swedish (10.6%, a difference of 0.46%).
| Demographics | Rating | Rank | Poverty |
| Bhutanese | 99.8 /100 | #12 | Exceptional 10.4% |
| Immigrants | Hong Kong | 99.8 /100 | #13 | Exceptional 10.4% |
| Immigrants | Bolivia | 99.8 /100 | #14 | Exceptional 10.4% |
| Bolivians | 99.8 /100 | #15 | Exceptional 10.4% |
| Lithuanians | 99.8 /100 | #16 | Exceptional 10.5% |
| Norwegians | 99.8 /100 | #17 | Exceptional 10.5% |
| Latvians | 99.8 /100 | #18 | Exceptional 10.5% |
| Immigrants | Scotland | 99.7 /100 | #19 | Exceptional 10.6% |
| Immigrants | North Macedonia | 99.7 /100 | #20 | Exceptional 10.6% |
| Luxembourgers | 99.7 /100 | #21 | Exceptional 10.6% |
| Eastern Europeans | 99.7 /100 | #22 | Exceptional 10.6% |
| Swedes | 99.7 /100 | #23 | Exceptional 10.6% |
| Italians | 99.7 /100 | #24 | Exceptional 10.6% |
| Croatians | 99.6 /100 | #25 | Exceptional 10.6% |
| Burmese | 99.6 /100 | #26 | Exceptional 10.7% |