Soviet Union vs Immigrants from Czechoslovakia Per Capita Income
COMPARE
Soviet Union
Immigrants from Czechoslovakia
Per Capita Income
Per Capita Income Comparison
Soviet Union
Immigrants from Czechoslovakia
$54,202
PER CAPITA INCOME
100.0/ 100
METRIC RATING
20th/ 347
METRIC RANK
$51,770
PER CAPITA INCOME
100.0/ 100
METRIC RATING
38th/ 347
METRIC RANK
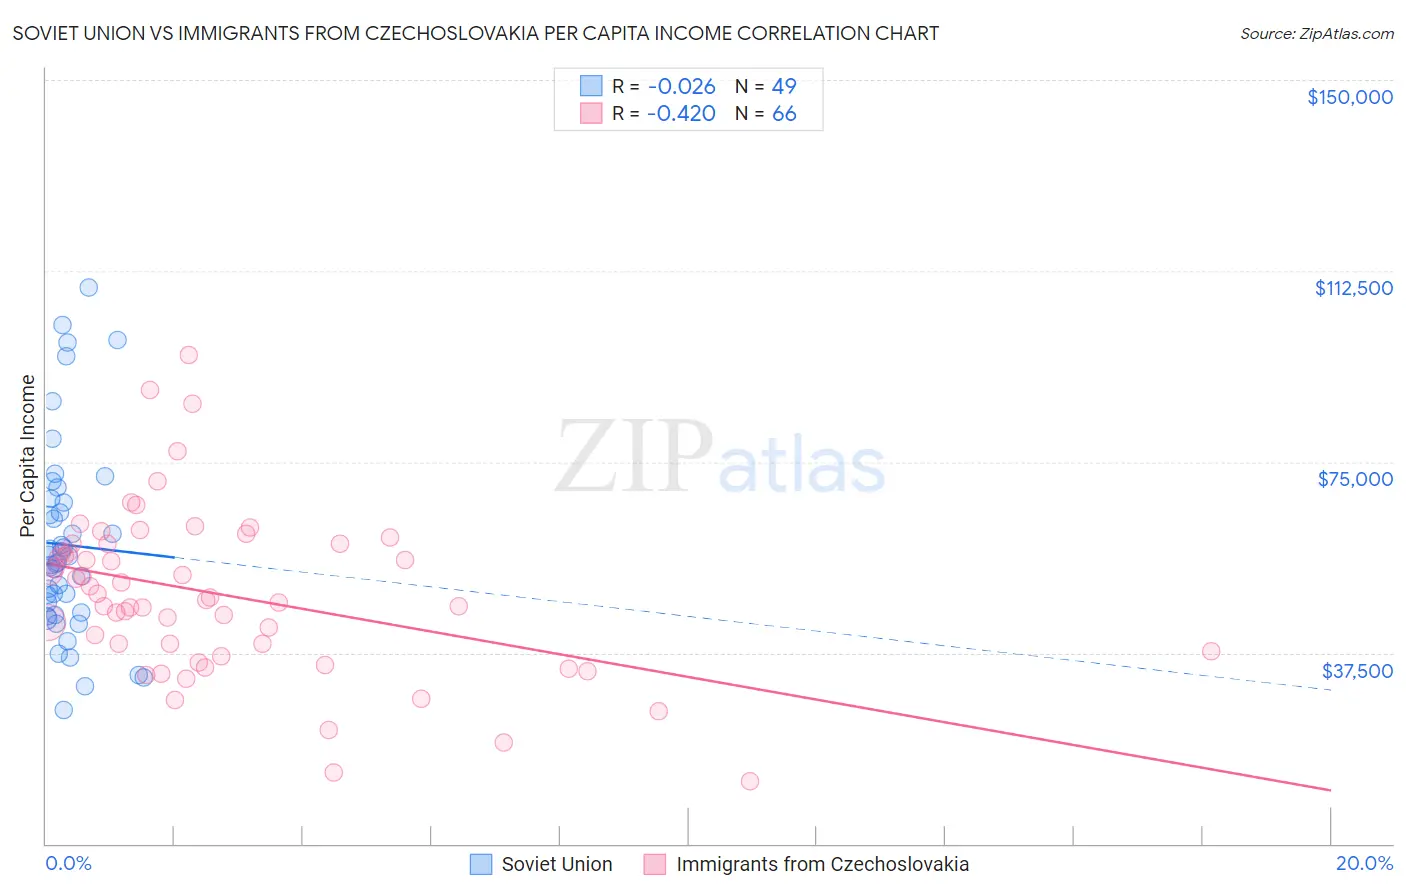
Soviet Union vs Immigrants from Czechoslovakia Per Capita Income Correlation Chart
The statistical analysis conducted on geographies consisting of 43,511,973 people shows no correlation between the proportion of Soviet Union and per capita income in the United States with a correlation coefficient (R) of -0.026 and weighted average of $54,202. Similarly, the statistical analysis conducted on geographies consisting of 195,456,516 people shows a moderate negative correlation between the proportion of Immigrants from Czechoslovakia and per capita income in the United States with a correlation coefficient (R) of -0.420 and weighted average of $51,770, a difference of 4.7%.
Per Capita Income Correlation Summary
| Measurement | Soviet Union | Immigrants from Czechoslovakia |
| Minimum | $26,314 | $12,340 |
| Maximum | $109,367 | $95,878 |
| Range | $83,053 | $83,538 |
| Mean | $58,669 | $48,860 |
| Median | $55,152 | $48,155 |
| Interquartile 25% (IQ1) | $45,115 | $37,887 |
| Interquartile 75% (IQ3) | $67,421 | $58,814 |
| Interquartile Range (IQR) | $22,306 | $20,927 |
| Standard Deviation (Sample) | $19,133 | $16,197 |
| Standard Deviation (Population) | $18,936 | $16,074 |
Demographics Similar to Soviet Union and Immigrants from Czechoslovakia by Per Capita Income
In terms of per capita income, the demographic groups most similar to Soviet Union are Immigrants from Northern Europe ($54,159, a difference of 0.080%), Immigrants from China ($54,264, a difference of 0.11%), Indian (Asian) ($53,874, a difference of 0.61%), Immigrants from Eastern Asia ($53,806, a difference of 0.74%), and Immigrants from Denmark ($53,799, a difference of 0.75%). Similarly, the demographic groups most similar to Immigrants from Czechoslovakia are Cambodian ($51,731, a difference of 0.070%), Estonian ($51,875, a difference of 0.20%), Immigrants from Greece ($51,891, a difference of 0.23%), Burmese ($52,005, a difference of 0.45%), and Immigrants from Russia ($52,044, a difference of 0.53%).
| Demographics | Rating | Rank | Per Capita Income |
| Immigrants | China | 100.0 /100 | #19 | Exceptional $54,264 |
| Soviet Union | 100.0 /100 | #20 | Exceptional $54,202 |
| Immigrants | Northern Europe | 100.0 /100 | #21 | Exceptional $54,159 |
| Indians (Asian) | 100.0 /100 | #22 | Exceptional $53,874 |
| Immigrants | Eastern Asia | 100.0 /100 | #23 | Exceptional $53,806 |
| Immigrants | Denmark | 100.0 /100 | #24 | Exceptional $53,799 |
| Immigrants | Japan | 100.0 /100 | #25 | Exceptional $53,359 |
| Russians | 100.0 /100 | #26 | Exceptional $53,154 |
| Immigrants | South Central Asia | 100.0 /100 | #27 | Exceptional $52,660 |
| Latvians | 100.0 /100 | #28 | Exceptional $52,649 |
| Israelis | 100.0 /100 | #29 | Exceptional $52,596 |
| Immigrants | Austria | 100.0 /100 | #30 | Exceptional $52,503 |
| Turks | 100.0 /100 | #31 | Exceptional $52,391 |
| Immigrants | Norway | 100.0 /100 | #32 | Exceptional $52,217 |
| Australians | 100.0 /100 | #33 | Exceptional $52,074 |
| Immigrants | Russia | 100.0 /100 | #34 | Exceptional $52,044 |
| Burmese | 100.0 /100 | #35 | Exceptional $52,005 |
| Immigrants | Greece | 100.0 /100 | #36 | Exceptional $51,891 |
| Estonians | 100.0 /100 | #37 | Exceptional $51,875 |
| Immigrants | Czechoslovakia | 100.0 /100 | #38 | Exceptional $51,770 |
| Cambodians | 100.0 /100 | #39 | Exceptional $51,731 |