Somali vs Polish Poverty
COMPARE
Somali
Polish
Poverty
Poverty Comparison
Somalis
Poles
15.4%
POVERTY
0.0/ 100
METRIC RATING
302nd/ 347
METRIC RANK
10.7%
POVERTY
99.5/ 100
METRIC RATING
31st/ 347
METRIC RANK
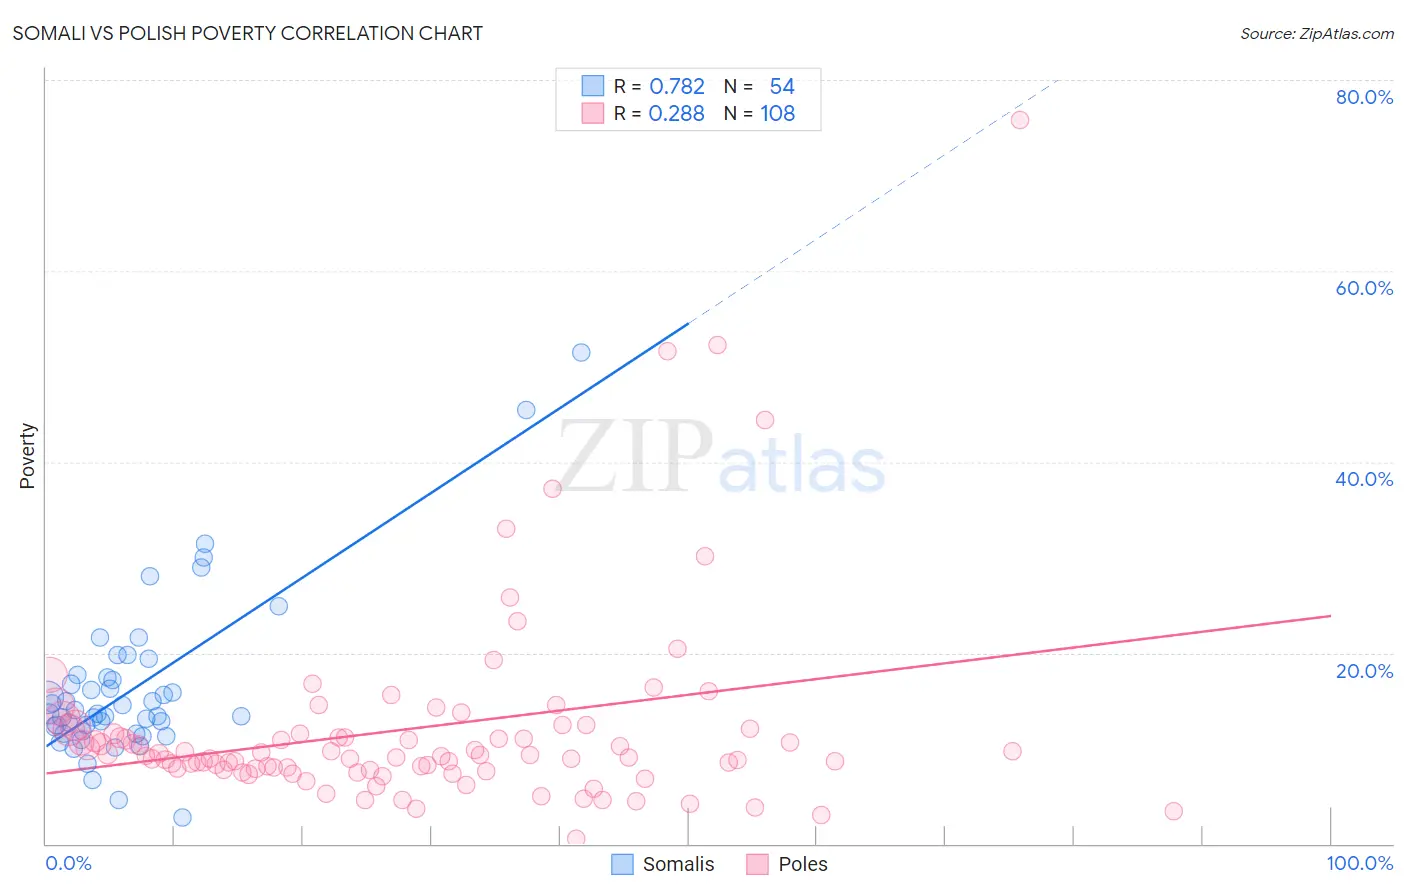
Somali vs Polish Poverty Correlation Chart
The statistical analysis conducted on geographies consisting of 99,289,063 people shows a strong positive correlation between the proportion of Somalis and poverty level in the United States with a correlation coefficient (R) of 0.782 and weighted average of 15.4%. Similarly, the statistical analysis conducted on geographies consisting of 559,734,720 people shows a weak positive correlation between the proportion of Poles and poverty level in the United States with a correlation coefficient (R) of 0.288 and weighted average of 10.7%, a difference of 43.6%.
Poverty Correlation Summary
| Measurement | Somali | Polish |
| Minimum | 2.7% | 0.55% |
| Maximum | 51.5% | 75.7% |
| Range | 48.8% | 75.2% |
| Mean | 16.2% | 12.1% |
| Median | 13.6% | 9.2% |
| Interquartile 25% (IQ1) | 11.8% | 7.8% |
| Interquartile 75% (IQ3) | 17.4% | 11.7% |
| Interquartile Range (IQR) | 5.6% | 3.9% |
| Standard Deviation (Sample) | 8.6% | 10.5% |
| Standard Deviation (Population) | 8.5% | 10.5% |
Similar Demographics by Poverty
Demographics Similar to Somalis by Poverty
In terms of poverty, the demographic groups most similar to Somalis are Bahamian (15.4%, a difference of 0.13%), Immigrants from Central America (15.4%, a difference of 0.34%), Immigrants from Caribbean (15.5%, a difference of 0.48%), Immigrants from Mexico (15.5%, a difference of 0.57%), and Immigrants from Guatemala (15.5%, a difference of 0.61%).
| Demographics | Rating | Rank | Poverty |
| Guatemalans | 0.0 /100 | #295 | Tragic 15.3% |
| Hispanics or Latinos | 0.0 /100 | #296 | Tragic 15.3% |
| Immigrants | Bangladesh | 0.0 /100 | #297 | Tragic 15.3% |
| Immigrants | Senegal | 0.0 /100 | #298 | Tragic 15.3% |
| Senegalese | 0.0 /100 | #299 | Tragic 15.3% |
| Immigrants | Central America | 0.0 /100 | #300 | Tragic 15.4% |
| Bahamians | 0.0 /100 | #301 | Tragic 15.4% |
| Somalis | 0.0 /100 | #302 | Tragic 15.4% |
| Immigrants | Caribbean | 0.0 /100 | #303 | Tragic 15.5% |
| Immigrants | Mexico | 0.0 /100 | #304 | Tragic 15.5% |
| Immigrants | Guatemala | 0.0 /100 | #305 | Tragic 15.5% |
| Creek | 0.0 /100 | #306 | Tragic 15.6% |
| Africans | 0.0 /100 | #307 | Tragic 15.6% |
| Choctaw | 0.0 /100 | #308 | Tragic 15.6% |
| Seminole | 0.0 /100 | #309 | Tragic 15.6% |
Demographics Similar to Poles by Poverty
In terms of poverty, the demographic groups most similar to Poles are Danish (10.7%, a difference of 0.080%), Greek (10.7%, a difference of 0.090%), Iranian (10.7%, a difference of 0.090%), Immigrants from Korea (10.7%, a difference of 0.19%), and Immigrants from Northern Europe (10.7%, a difference of 0.25%).
| Demographics | Rating | Rank | Poverty |
| Italians | 99.7 /100 | #24 | Exceptional 10.6% |
| Croatians | 99.6 /100 | #25 | Exceptional 10.6% |
| Burmese | 99.6 /100 | #26 | Exceptional 10.7% |
| Immigrants | Northern Europe | 99.6 /100 | #27 | Exceptional 10.7% |
| Immigrants | Korea | 99.5 /100 | #28 | Exceptional 10.7% |
| Greeks | 99.5 /100 | #29 | Exceptional 10.7% |
| Danes | 99.5 /100 | #30 | Exceptional 10.7% |
| Poles | 99.5 /100 | #31 | Exceptional 10.7% |
| Iranians | 99.5 /100 | #32 | Exceptional 10.7% |
| Macedonians | 99.4 /100 | #33 | Exceptional 10.8% |
| Immigrants | Poland | 99.4 /100 | #34 | Exceptional 10.8% |
| Tongans | 99.4 /100 | #35 | Exceptional 10.8% |
| Cypriots | 99.3 /100 | #36 | Exceptional 10.8% |
| Immigrants | Greece | 99.3 /100 | #37 | Exceptional 10.8% |
| Czechs | 99.3 /100 | #38 | Exceptional 10.8% |