Somali vs Cherokee Poverty
COMPARE
Somali
Cherokee
Poverty
Poverty Comparison
Somalis
Cherokee
15.4%
POVERTY
0.0/ 100
METRIC RATING
302nd/ 347
METRIC RANK
14.4%
POVERTY
0.1/ 100
METRIC RATING
261st/ 347
METRIC RANK
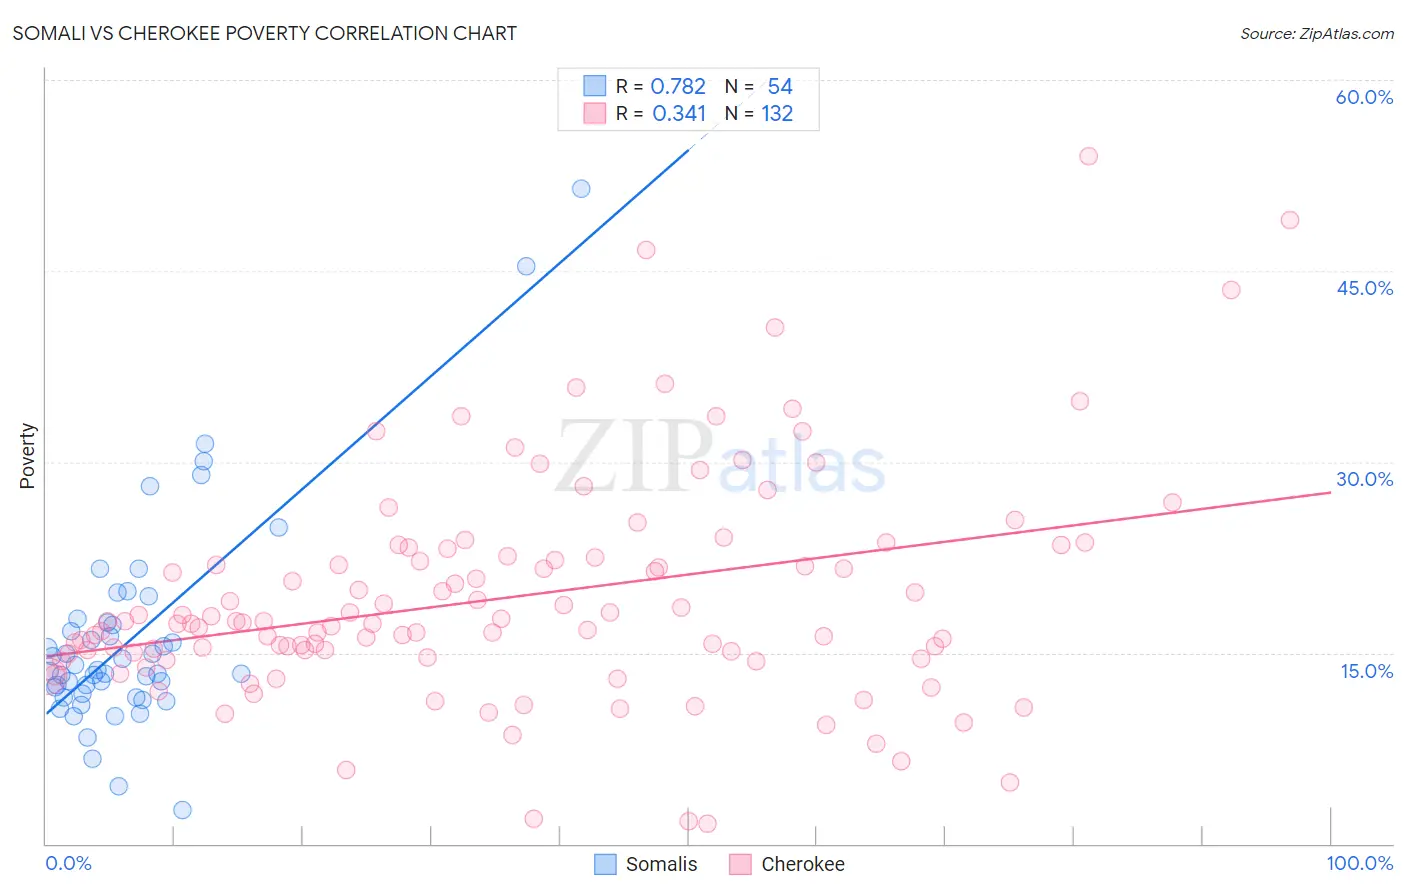
Somali vs Cherokee Poverty Correlation Chart
The statistical analysis conducted on geographies consisting of 99,289,063 people shows a strong positive correlation between the proportion of Somalis and poverty level in the United States with a correlation coefficient (R) of 0.782 and weighted average of 15.4%. Similarly, the statistical analysis conducted on geographies consisting of 493,337,715 people shows a mild positive correlation between the proportion of Cherokee and poverty level in the United States with a correlation coefficient (R) of 0.341 and weighted average of 14.4%, a difference of 7.4%.
Poverty Correlation Summary
| Measurement | Somali | Cherokee |
| Minimum | 2.7% | 1.6% |
| Maximum | 51.5% | 54.1% |
| Range | 48.8% | 52.4% |
| Mean | 16.2% | 19.3% |
| Median | 13.6% | 17.3% |
| Interquartile 25% (IQ1) | 11.8% | 14.8% |
| Interquartile 75% (IQ3) | 17.4% | 22.5% |
| Interquartile Range (IQR) | 5.6% | 7.7% |
| Standard Deviation (Sample) | 8.6% | 8.8% |
| Standard Deviation (Population) | 8.5% | 8.8% |
Similar Demographics by Poverty
Demographics Similar to Somalis by Poverty
In terms of poverty, the demographic groups most similar to Somalis are Bahamian (15.4%, a difference of 0.13%), Immigrants from Central America (15.4%, a difference of 0.34%), Immigrants from Caribbean (15.5%, a difference of 0.48%), Immigrants from Mexico (15.5%, a difference of 0.57%), and Immigrants from Guatemala (15.5%, a difference of 0.61%).
| Demographics | Rating | Rank | Poverty |
| Guatemalans | 0.0 /100 | #295 | Tragic 15.3% |
| Hispanics or Latinos | 0.0 /100 | #296 | Tragic 15.3% |
| Immigrants | Bangladesh | 0.0 /100 | #297 | Tragic 15.3% |
| Immigrants | Senegal | 0.0 /100 | #298 | Tragic 15.3% |
| Senegalese | 0.0 /100 | #299 | Tragic 15.3% |
| Immigrants | Central America | 0.0 /100 | #300 | Tragic 15.4% |
| Bahamians | 0.0 /100 | #301 | Tragic 15.4% |
| Somalis | 0.0 /100 | #302 | Tragic 15.4% |
| Immigrants | Caribbean | 0.0 /100 | #303 | Tragic 15.5% |
| Immigrants | Mexico | 0.0 /100 | #304 | Tragic 15.5% |
| Immigrants | Guatemala | 0.0 /100 | #305 | Tragic 15.5% |
| Creek | 0.0 /100 | #306 | Tragic 15.6% |
| Africans | 0.0 /100 | #307 | Tragic 15.6% |
| Choctaw | 0.0 /100 | #308 | Tragic 15.6% |
| Seminole | 0.0 /100 | #309 | Tragic 15.6% |
Demographics Similar to Cherokee by Poverty
In terms of poverty, the demographic groups most similar to Cherokee are Cape Verdean (14.4%, a difference of 0.020%), Immigrants from Nicaragua (14.3%, a difference of 0.10%), Immigrants from Liberia (14.4%, a difference of 0.16%), Ottawa (14.3%, a difference of 0.37%), and Trinidadian and Tobagonian (14.3%, a difference of 0.38%).
| Demographics | Rating | Rank | Poverty |
| Immigrants | El Salvador | 0.1 /100 | #254 | Tragic 14.3% |
| Immigrants | Ecuador | 0.1 /100 | #255 | Tragic 14.3% |
| Mexican American Indians | 0.1 /100 | #256 | Tragic 14.3% |
| Trinidadians and Tobagonians | 0.1 /100 | #257 | Tragic 14.3% |
| Ottawa | 0.1 /100 | #258 | Tragic 14.3% |
| Immigrants | Nicaragua | 0.1 /100 | #259 | Tragic 14.3% |
| Cape Verdeans | 0.1 /100 | #260 | Tragic 14.4% |
| Cherokee | 0.1 /100 | #261 | Tragic 14.4% |
| Immigrants | Liberia | 0.1 /100 | #262 | Tragic 14.4% |
| Jamaicans | 0.1 /100 | #263 | Tragic 14.4% |
| Immigrants | Jamaica | 0.1 /100 | #264 | Tragic 14.4% |
| Immigrants | Guyana | 0.1 /100 | #265 | Tragic 14.5% |
| Guyanese | 0.1 /100 | #266 | Tragic 14.5% |
| Iroquois | 0.1 /100 | #267 | Tragic 14.5% |
| Sub-Saharan Africans | 0.1 /100 | #268 | Tragic 14.5% |