Immigrants from Eastern Europe vs Cherokee Poverty
COMPARE
Immigrants from Eastern Europe
Cherokee
Poverty
Poverty Comparison
Immigrants from Eastern Europe
Cherokee
11.3%
POVERTY
97.0/ 100
METRIC RATING
75th/ 347
METRIC RANK
14.4%
POVERTY
0.1/ 100
METRIC RATING
261st/ 347
METRIC RANK
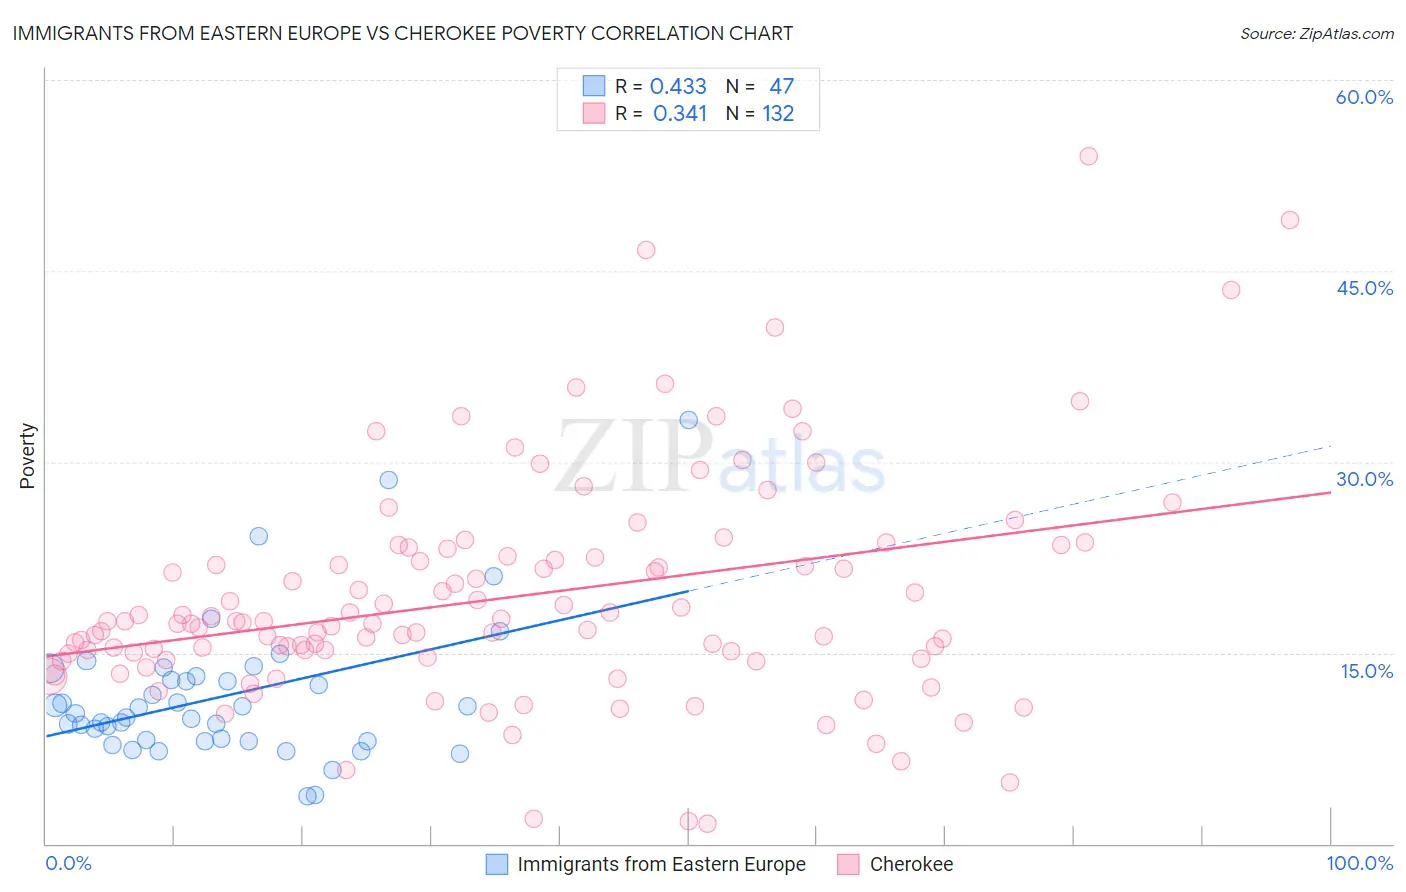
Immigrants from Eastern Europe vs Cherokee Poverty Correlation Chart
The statistical analysis conducted on geographies consisting of 475,463,509 people shows a moderate positive correlation between the proportion of Immigrants from Eastern Europe and poverty level in the United States with a correlation coefficient (R) of 0.433 and weighted average of 11.3%. Similarly, the statistical analysis conducted on geographies consisting of 493,337,715 people shows a mild positive correlation between the proportion of Cherokee and poverty level in the United States with a correlation coefficient (R) of 0.341 and weighted average of 14.4%, a difference of 27.2%.
Poverty Correlation Summary
| Measurement | Immigrants from Eastern Europe | Cherokee |
| Minimum | 3.8% | 1.6% |
| Maximum | 33.3% | 54.1% |
| Range | 29.6% | 52.4% |
| Mean | 11.6% | 19.3% |
| Median | 10.2% | 17.3% |
| Interquartile 25% (IQ1) | 8.1% | 14.8% |
| Interquartile 75% (IQ3) | 13.2% | 22.5% |
| Interquartile Range (IQR) | 5.1% | 7.7% |
| Standard Deviation (Sample) | 5.7% | 8.8% |
| Standard Deviation (Population) | 5.6% | 8.8% |
Similar Demographics by Poverty
Demographics Similar to Immigrants from Eastern Europe by Poverty
In terms of poverty, the demographic groups most similar to Immigrants from Eastern Europe are Immigrants from North America (11.3%, a difference of 0.15%), Carpatho Rusyn (11.3%, a difference of 0.19%), Immigrants from Eastern Asia (11.3%, a difference of 0.22%), European (11.3%, a difference of 0.24%), and Immigrants from Belgium (11.3%, a difference of 0.24%).
| Demographics | Rating | Rank | Poverty |
| Slovaks | 97.4 /100 | #68 | Exceptional 11.2% |
| Serbians | 97.4 /100 | #69 | Exceptional 11.2% |
| Immigrants | Canada | 97.3 /100 | #70 | Exceptional 11.3% |
| Zimbabweans | 97.3 /100 | #71 | Exceptional 11.3% |
| Europeans | 97.2 /100 | #72 | Exceptional 11.3% |
| Immigrants | Belgium | 97.2 /100 | #73 | Exceptional 11.3% |
| Carpatho Rusyns | 97.2 /100 | #74 | Exceptional 11.3% |
| Immigrants | Eastern Europe | 97.0 /100 | #75 | Exceptional 11.3% |
| Immigrants | North America | 96.8 /100 | #76 | Exceptional 11.3% |
| Immigrants | Eastern Asia | 96.7 /100 | #77 | Exceptional 11.3% |
| Dutch | 96.7 /100 | #78 | Exceptional 11.3% |
| Cambodians | 96.7 /100 | #79 | Exceptional 11.3% |
| Indians (Asian) | 96.6 /100 | #80 | Exceptional 11.3% |
| Irish | 96.6 /100 | #81 | Exceptional 11.3% |
| Egyptians | 96.5 /100 | #82 | Exceptional 11.3% |
Demographics Similar to Cherokee by Poverty
In terms of poverty, the demographic groups most similar to Cherokee are Cape Verdean (14.4%, a difference of 0.020%), Immigrants from Nicaragua (14.3%, a difference of 0.10%), Immigrants from Liberia (14.4%, a difference of 0.16%), Ottawa (14.3%, a difference of 0.37%), and Trinidadian and Tobagonian (14.3%, a difference of 0.38%).
| Demographics | Rating | Rank | Poverty |
| Immigrants | El Salvador | 0.1 /100 | #254 | Tragic 14.3% |
| Immigrants | Ecuador | 0.1 /100 | #255 | Tragic 14.3% |
| Mexican American Indians | 0.1 /100 | #256 | Tragic 14.3% |
| Trinidadians and Tobagonians | 0.1 /100 | #257 | Tragic 14.3% |
| Ottawa | 0.1 /100 | #258 | Tragic 14.3% |
| Immigrants | Nicaragua | 0.1 /100 | #259 | Tragic 14.3% |
| Cape Verdeans | 0.1 /100 | #260 | Tragic 14.4% |
| Cherokee | 0.1 /100 | #261 | Tragic 14.4% |
| Immigrants | Liberia | 0.1 /100 | #262 | Tragic 14.4% |
| Jamaicans | 0.1 /100 | #263 | Tragic 14.4% |
| Immigrants | Jamaica | 0.1 /100 | #264 | Tragic 14.4% |
| Immigrants | Guyana | 0.1 /100 | #265 | Tragic 14.5% |
| Guyanese | 0.1 /100 | #266 | Tragic 14.5% |
| Iroquois | 0.1 /100 | #267 | Tragic 14.5% |
| Sub-Saharan Africans | 0.1 /100 | #268 | Tragic 14.5% |