Somali vs Cherokee 8th Grade
COMPARE
Somali
Cherokee
8th Grade
8th Grade Comparison
Somalis
Cherokee
95.1%
8TH GRADE
1.4/ 100
METRIC RATING
246th/ 347
METRIC RANK
96.5%
8TH GRADE
99.0/ 100
METRIC RATING
86th/ 347
METRIC RANK
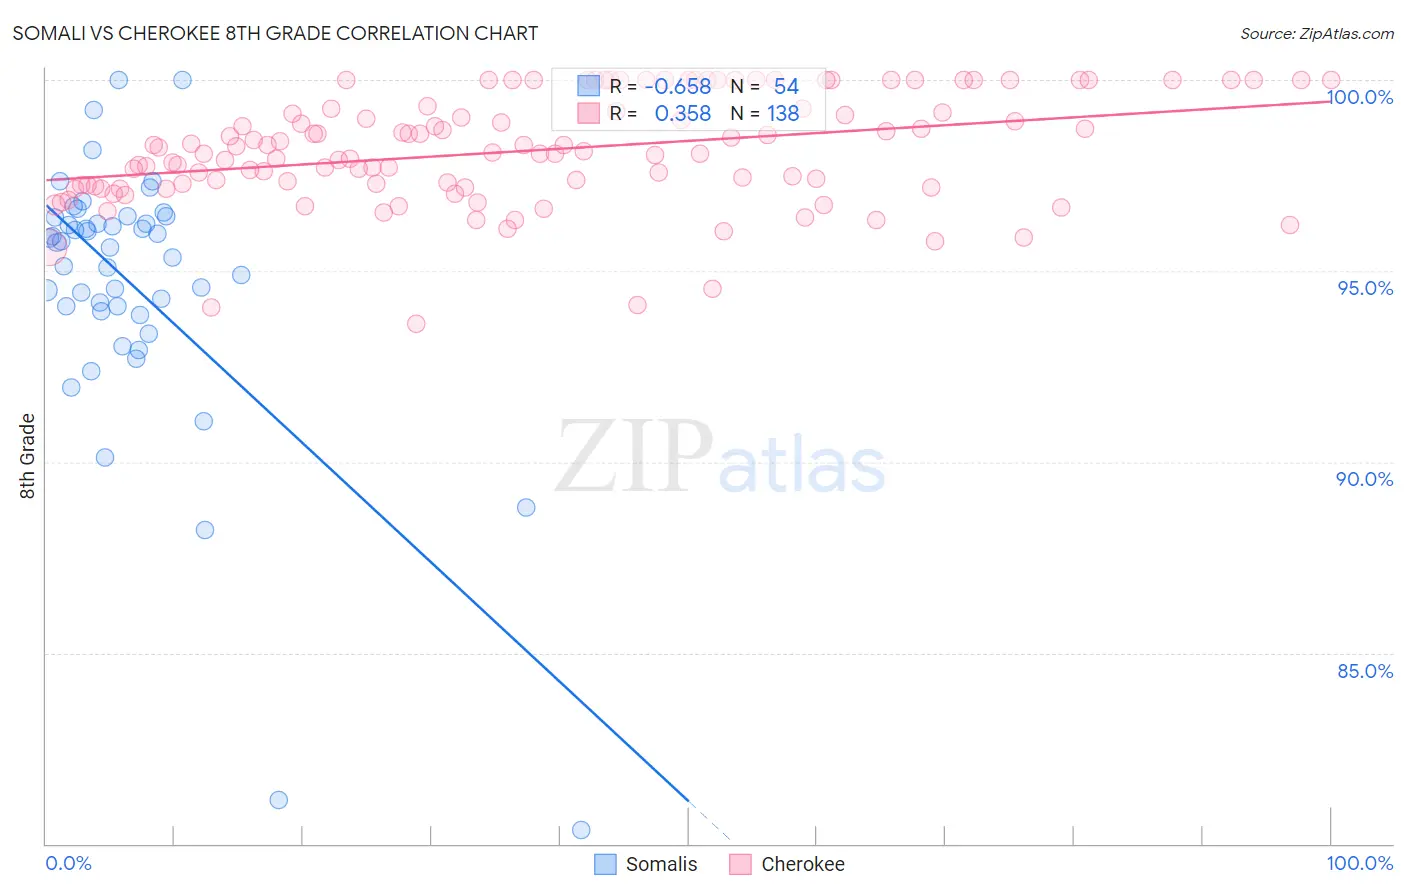
Somali vs Cherokee 8th Grade Correlation Chart
The statistical analysis conducted on geographies consisting of 99,332,457 people shows a significant negative correlation between the proportion of Somalis and percentage of population with at least 8th grade education in the United States with a correlation coefficient (R) of -0.658 and weighted average of 95.1%. Similarly, the statistical analysis conducted on geographies consisting of 493,719,571 people shows a mild positive correlation between the proportion of Cherokee and percentage of population with at least 8th grade education in the United States with a correlation coefficient (R) of 0.358 and weighted average of 96.5%, a difference of 1.5%.
8th Grade Correlation Summary
| Measurement | Somali | Cherokee |
| Minimum | 80.4% | 93.6% |
| Maximum | 100.0% | 100.0% |
| Range | 19.6% | 6.4% |
| Mean | 94.6% | 98.2% |
| Median | 95.7% | 98.1% |
| Interquartile 25% (IQ1) | 94.0% | 97.2% |
| Interquartile 75% (IQ3) | 96.4% | 99.2% |
| Interquartile Range (IQR) | 2.4% | 2.0% |
| Standard Deviation (Sample) | 3.6% | 1.4% |
| Standard Deviation (Population) | 3.6% | 1.4% |
Similar Demographics by 8th Grade
Demographics Similar to Somalis by 8th Grade
In terms of 8th grade, the demographic groups most similar to Somalis are Immigrants from Senegal (95.1%, a difference of 0.0%), Jamaican (95.1%, a difference of 0.010%), Uruguayan (95.1%, a difference of 0.020%), Tongan (95.1%, a difference of 0.040%), and Paiute (95.1%, a difference of 0.040%).
| Demographics | Rating | Rank | 8th Grade |
| Immigrants | Sierra Leone | 2.1 /100 | #239 | Tragic 95.1% |
| Ethiopians | 2.0 /100 | #240 | Tragic 95.1% |
| South American Indians | 1.9 /100 | #241 | Tragic 95.1% |
| Tongans | 1.7 /100 | #242 | Tragic 95.1% |
| Paiute | 1.7 /100 | #243 | Tragic 95.1% |
| Immigrants | Middle Africa | 1.7 /100 | #244 | Tragic 95.1% |
| Jamaicans | 1.4 /100 | #245 | Tragic 95.1% |
| Somalis | 1.4 /100 | #246 | Tragic 95.1% |
| Immigrants | Senegal | 1.4 /100 | #247 | Tragic 95.1% |
| Uruguayans | 1.2 /100 | #248 | Tragic 95.1% |
| Immigrants | China | 1.1 /100 | #249 | Tragic 95.0% |
| Koreans | 1.1 /100 | #250 | Tragic 95.0% |
| Bolivians | 1.0 /100 | #251 | Tragic 95.0% |
| Immigrants | Ethiopia | 1.0 /100 | #252 | Tragic 95.0% |
| U.S. Virgin Islanders | 0.9 /100 | #253 | Tragic 95.0% |
Demographics Similar to Cherokee by 8th Grade
In terms of 8th grade, the demographic groups most similar to Cherokee are Immigrants from South Africa (96.5%, a difference of 0.0%), Immigrants from Australia (96.5%, a difference of 0.0%), Immigrants from Belgium (96.5%, a difference of 0.010%), Immigrants from Western Europe (96.4%, a difference of 0.010%), and Icelander (96.5%, a difference of 0.020%).
| Demographics | Rating | Rank | 8th Grade |
| Puget Sound Salish | 99.3 /100 | #79 | Exceptional 96.5% |
| Delaware | 99.2 /100 | #80 | Exceptional 96.5% |
| Romanians | 99.2 /100 | #81 | Exceptional 96.5% |
| Turks | 99.2 /100 | #82 | Exceptional 96.5% |
| Icelanders | 99.2 /100 | #83 | Exceptional 96.5% |
| Immigrants | Belgium | 99.1 /100 | #84 | Exceptional 96.5% |
| Immigrants | South Africa | 99.1 /100 | #85 | Exceptional 96.5% |
| Cherokee | 99.0 /100 | #86 | Exceptional 96.5% |
| Immigrants | Australia | 99.0 /100 | #87 | Exceptional 96.5% |
| Immigrants | Western Europe | 99.0 /100 | #88 | Exceptional 96.4% |
| Chickasaw | 98.9 /100 | #89 | Exceptional 96.4% |
| Immigrants | Sweden | 98.9 /100 | #90 | Exceptional 96.4% |
| Thais | 98.9 /100 | #91 | Exceptional 96.4% |
| Menominee | 98.9 /100 | #92 | Exceptional 96.4% |
| Immigrants | Denmark | 98.8 /100 | #93 | Exceptional 96.4% |