Slovene vs Immigrants from Indonesia Single Father Poverty
COMPARE
Slovene
Immigrants from Indonesia
Single Father Poverty
Single Father Poverty Comparison
Slovenes
Immigrants from Indonesia
17.3%
SINGLE FATHER POVERTY
0.3/ 100
METRIC RATING
264th/ 347
METRIC RANK
14.7%
SINGLE FATHER POVERTY
100.0/ 100
METRIC RATING
36th/ 347
METRIC RANK
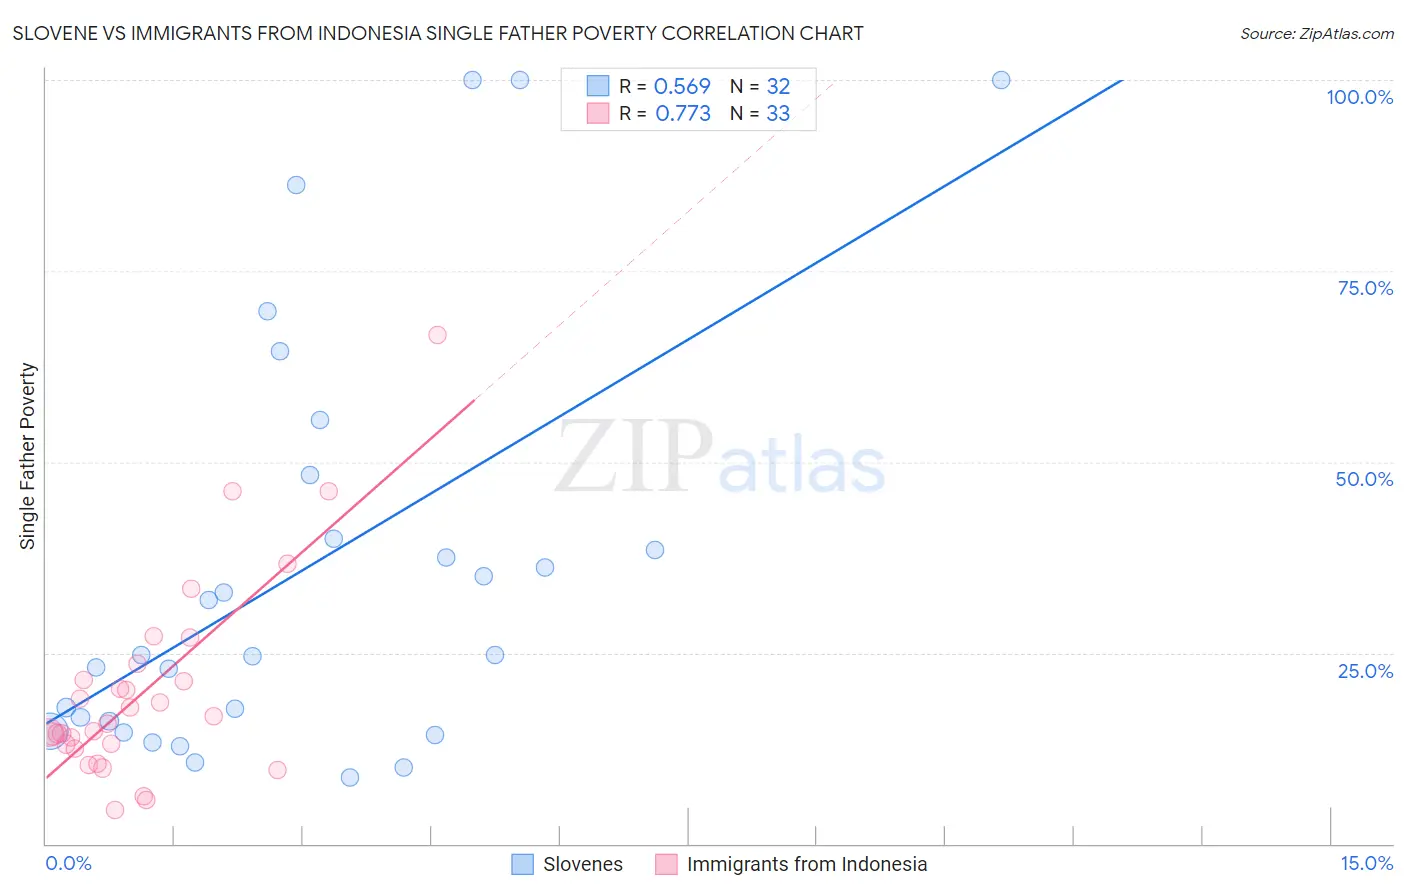
Slovene vs Immigrants from Indonesia Single Father Poverty Correlation Chart
The statistical analysis conducted on geographies consisting of 209,649,531 people shows a substantial positive correlation between the proportion of Slovenes and poverty level among single fathers in the United States with a correlation coefficient (R) of 0.569 and weighted average of 17.3%. Similarly, the statistical analysis conducted on geographies consisting of 182,124,280 people shows a strong positive correlation between the proportion of Immigrants from Indonesia and poverty level among single fathers in the United States with a correlation coefficient (R) of 0.773 and weighted average of 14.7%, a difference of 17.9%.
Single Father Poverty Correlation Summary
| Measurement | Slovene | Immigrants from Indonesia |
| Minimum | 8.6% | 4.4% |
| Maximum | 100.0% | 66.7% |
| Range | 91.4% | 62.2% |
| Mean | 36.3% | 20.0% |
| Median | 24.8% | 15.7% |
| Interquartile 25% (IQ1) | 15.4% | 12.8% |
| Interquartile 75% (IQ3) | 44.1% | 22.5% |
| Interquartile Range (IQR) | 28.7% | 9.8% |
| Standard Deviation (Sample) | 27.8% | 13.1% |
| Standard Deviation (Population) | 27.4% | 12.9% |
Similar Demographics by Single Father Poverty
Demographics Similar to Slovenes by Single Father Poverty
In terms of single father poverty, the demographic groups most similar to Slovenes are Polish (17.3%, a difference of 0.0%), Jamaican (17.3%, a difference of 0.060%), Haitian (17.3%, a difference of 0.10%), Lithuanian (17.3%, a difference of 0.20%), and Immigrants from Caribbean (17.4%, a difference of 0.20%).
| Demographics | Rating | Rank | Single Father Poverty |
| Immigrants | Albania | 0.7 /100 | #257 | Tragic 17.2% |
| Albanians | 0.7 /100 | #258 | Tragic 17.2% |
| Immigrants | Jamaica | 0.7 /100 | #259 | Tragic 17.2% |
| Spaniards | 0.6 /100 | #260 | Tragic 17.2% |
| Swiss | 0.5 /100 | #261 | Tragic 17.3% |
| Immigrants | Zaire | 0.4 /100 | #262 | Tragic 17.3% |
| Lithuanians | 0.4 /100 | #263 | Tragic 17.3% |
| Slovenes | 0.3 /100 | #264 | Tragic 17.3% |
| Poles | 0.3 /100 | #265 | Tragic 17.3% |
| Jamaicans | 0.3 /100 | #266 | Tragic 17.3% |
| Haitians | 0.3 /100 | #267 | Tragic 17.3% |
| Immigrants | Caribbean | 0.3 /100 | #268 | Tragic 17.4% |
| Slavs | 0.3 /100 | #269 | Tragic 17.4% |
| Indonesians | 0.2 /100 | #270 | Tragic 17.4% |
| French American Indians | 0.2 /100 | #271 | Tragic 17.4% |
Demographics Similar to Immigrants from Indonesia by Single Father Poverty
In terms of single father poverty, the demographic groups most similar to Immigrants from Indonesia are Immigrants from Eastern Africa (14.7%, a difference of 0.13%), Bolivian (14.7%, a difference of 0.14%), Immigrants from Bolivia (14.7%, a difference of 0.17%), Egyptian (14.7%, a difference of 0.24%), and Immigrants from Asia (14.7%, a difference of 0.31%).
| Demographics | Rating | Rank | Single Father Poverty |
| Somalis | 100.0 /100 | #29 | Exceptional 14.5% |
| Thais | 100.0 /100 | #30 | Exceptional 14.5% |
| Icelanders | 100.0 /100 | #31 | Exceptional 14.5% |
| Asians | 100.0 /100 | #32 | Exceptional 14.6% |
| Okinawans | 100.0 /100 | #33 | Exceptional 14.6% |
| Egyptians | 100.0 /100 | #34 | Exceptional 14.7% |
| Immigrants | Bolivia | 100.0 /100 | #35 | Exceptional 14.7% |
| Immigrants | Indonesia | 100.0 /100 | #36 | Exceptional 14.7% |
| Immigrants | Eastern Africa | 100.0 /100 | #37 | Exceptional 14.7% |
| Bolivians | 100.0 /100 | #38 | Exceptional 14.7% |
| Immigrants | Asia | 100.0 /100 | #39 | Exceptional 14.7% |
| Pima | 100.0 /100 | #40 | Exceptional 14.8% |
| Indians (Asian) | 100.0 /100 | #41 | Exceptional 14.8% |
| Immigrants | Nepal | 100.0 /100 | #42 | Exceptional 14.8% |
| Immigrants | Eritrea | 100.0 /100 | #43 | Exceptional 14.8% |