Slovene vs Scandinavian Female Poverty Among 25-34 Year Olds
COMPARE
Slovene
Scandinavian
Female Poverty Among 25-34 Year Olds
Female Poverty Among 25-34 Year Olds Comparison
Slovenes
Scandinavians
12.8%
FEMALE POVERTY AMONG 25-34 YEAR OLDS
92.7/ 100
METRIC RATING
123rd/ 347
METRIC RANK
13.1%
FEMALE POVERTY AMONG 25-34 YEAR OLDS
82.3/ 100
METRIC RATING
142nd/ 347
METRIC RANK
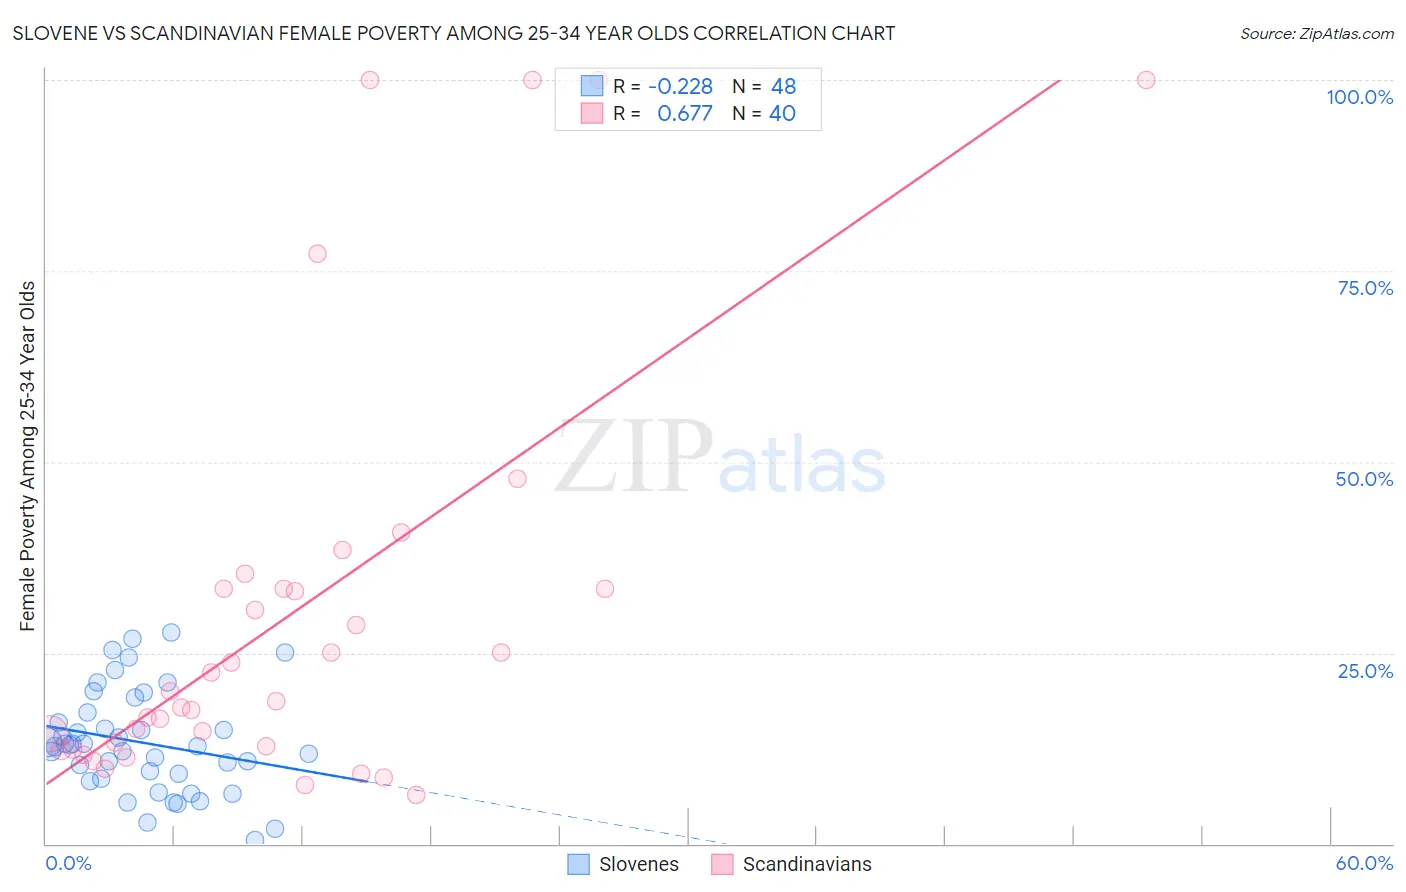
Slovene vs Scandinavian Female Poverty Among 25-34 Year Olds Correlation Chart
The statistical analysis conducted on geographies consisting of 257,613,004 people shows a weak negative correlation between the proportion of Slovenes and poverty level among females between the ages 25 and 34 in the United States with a correlation coefficient (R) of -0.228 and weighted average of 12.8%. Similarly, the statistical analysis conducted on geographies consisting of 460,488,930 people shows a significant positive correlation between the proportion of Scandinavians and poverty level among females between the ages 25 and 34 in the United States with a correlation coefficient (R) of 0.677 and weighted average of 13.1%, a difference of 2.2%.
Female Poverty Among 25-34 Year Olds Correlation Summary
| Measurement | Slovene | Scandinavian |
| Minimum | 0.42% | 6.4% |
| Maximum | 27.6% | 100.0% |
| Range | 27.2% | 93.6% |
| Mean | 13.3% | 30.1% |
| Median | 12.8% | 19.3% |
| Interquartile 25% (IQ1) | 8.8% | 12.6% |
| Interquartile 75% (IQ3) | 16.6% | 33.3% |
| Interquartile Range (IQR) | 7.8% | 20.7% |
| Standard Deviation (Sample) | 6.6% | 27.2% |
| Standard Deviation (Population) | 6.6% | 26.8% |
Demographics Similar to Slovenes and Scandinavians by Female Poverty Among 25-34 Year Olds
In terms of female poverty among 25-34 year olds, the demographic groups most similar to Slovenes are Immigrants from Western Asia (12.8%, a difference of 0.020%), Immigrants from Netherlands (12.8%, a difference of 0.22%), Immigrants from Canada (12.9%, a difference of 0.37%), Immigrants from Fiji (12.9%, a difference of 0.45%), and Czech (12.9%, a difference of 0.69%). Similarly, the demographic groups most similar to Scandinavians are New Zealander (13.1%, a difference of 0.16%), Immigrants from Iraq (13.1%, a difference of 0.20%), Austrian (13.1%, a difference of 0.21%), Brazilian (13.1%, a difference of 0.34%), and Immigrants from Chile (13.1%, a difference of 0.36%).
| Demographics | Rating | Rank | Female Poverty Among 25-34 Year Olds |
| Immigrants | Western Asia | 92.7 /100 | #122 | Exceptional 12.8% |
| Slovenes | 92.7 /100 | #123 | Exceptional 12.8% |
| Immigrants | Netherlands | 92.0 /100 | #124 | Exceptional 12.8% |
| Immigrants | Canada | 91.5 /100 | #125 | Exceptional 12.9% |
| Immigrants | Fiji | 91.2 /100 | #126 | Exceptional 12.9% |
| Czechs | 90.3 /100 | #127 | Exceptional 12.9% |
| Syrians | 90.2 /100 | #128 | Exceptional 12.9% |
| Immigrants | North America | 89.7 /100 | #129 | Excellent 12.9% |
| Immigrants | Uzbekistan | 89.6 /100 | #130 | Excellent 12.9% |
| Pakistanis | 88.4 /100 | #131 | Excellent 13.0% |
| Immigrants | Hungary | 88.3 /100 | #132 | Excellent 13.0% |
| Serbians | 87.6 /100 | #133 | Excellent 13.0% |
| Afghans | 85.8 /100 | #134 | Excellent 13.0% |
| South Africans | 85.7 /100 | #135 | Excellent 13.0% |
| Immigrants | England | 85.5 /100 | #136 | Excellent 13.0% |
| Immigrants | Chile | 84.6 /100 | #137 | Excellent 13.1% |
| Brazilians | 84.5 /100 | #138 | Excellent 13.1% |
| Austrians | 83.7 /100 | #139 | Excellent 13.1% |
| Immigrants | Iraq | 83.6 /100 | #140 | Excellent 13.1% |
| New Zealanders | 83.4 /100 | #141 | Excellent 13.1% |
| Scandinavians | 82.3 /100 | #142 | Excellent 13.1% |