Slovene vs Chilean Single Father Poverty
COMPARE
Slovene
Chilean
Single Father Poverty
Single Father Poverty Comparison
Slovenes
Chileans
17.3%
SINGLE FATHER POVERTY
0.3/ 100
METRIC RATING
264th/ 347
METRIC RANK
15.7%
SINGLE FATHER POVERTY
96.4/ 100
METRIC RATING
102nd/ 347
METRIC RANK
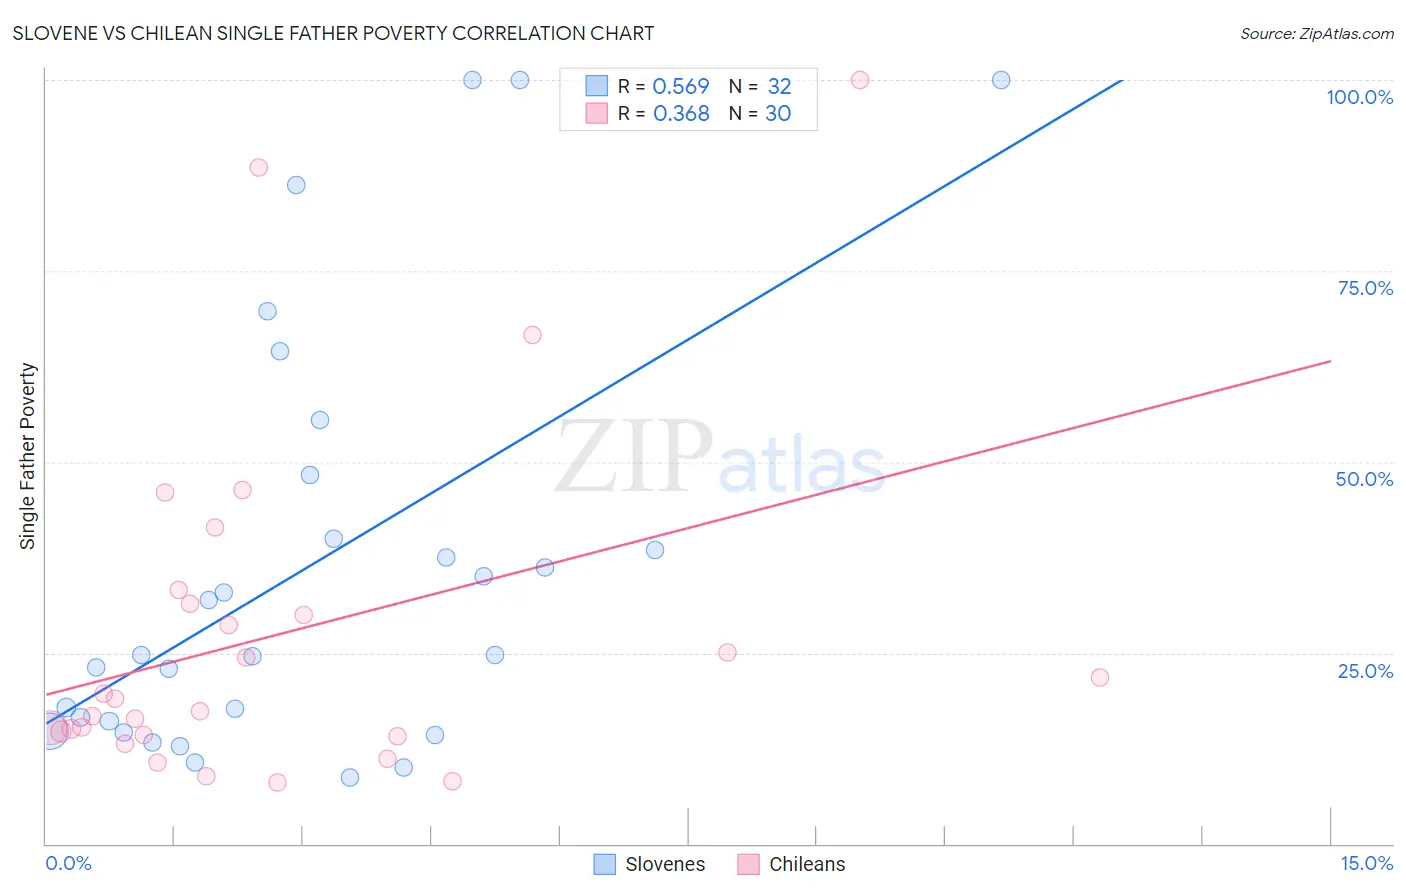
Slovene vs Chilean Single Father Poverty Correlation Chart
The statistical analysis conducted on geographies consisting of 209,649,531 people shows a substantial positive correlation between the proportion of Slovenes and poverty level among single fathers in the United States with a correlation coefficient (R) of 0.569 and weighted average of 17.3%. Similarly, the statistical analysis conducted on geographies consisting of 214,217,238 people shows a mild positive correlation between the proportion of Chileans and poverty level among single fathers in the United States with a correlation coefficient (R) of 0.368 and weighted average of 15.7%, a difference of 10.3%.
Single Father Poverty Correlation Summary
| Measurement | Slovene | Chilean |
| Minimum | 8.6% | 8.0% |
| Maximum | 100.0% | 100.0% |
| Range | 91.4% | 92.0% |
| Mean | 36.3% | 27.3% |
| Median | 24.8% | 18.2% |
| Interquartile 25% (IQ1) | 15.4% | 14.2% |
| Interquartile 75% (IQ3) | 44.1% | 31.4% |
| Interquartile Range (IQR) | 28.7% | 17.2% |
| Standard Deviation (Sample) | 27.8% | 22.6% |
| Standard Deviation (Population) | 27.4% | 22.2% |
Similar Demographics by Single Father Poverty
Demographics Similar to Slovenes by Single Father Poverty
In terms of single father poverty, the demographic groups most similar to Slovenes are Polish (17.3%, a difference of 0.0%), Jamaican (17.3%, a difference of 0.060%), Haitian (17.3%, a difference of 0.10%), Lithuanian (17.3%, a difference of 0.20%), and Immigrants from Caribbean (17.4%, a difference of 0.20%).
| Demographics | Rating | Rank | Single Father Poverty |
| Immigrants | Albania | 0.7 /100 | #257 | Tragic 17.2% |
| Albanians | 0.7 /100 | #258 | Tragic 17.2% |
| Immigrants | Jamaica | 0.7 /100 | #259 | Tragic 17.2% |
| Spaniards | 0.6 /100 | #260 | Tragic 17.2% |
| Swiss | 0.5 /100 | #261 | Tragic 17.3% |
| Immigrants | Zaire | 0.4 /100 | #262 | Tragic 17.3% |
| Lithuanians | 0.4 /100 | #263 | Tragic 17.3% |
| Slovenes | 0.3 /100 | #264 | Tragic 17.3% |
| Poles | 0.3 /100 | #265 | Tragic 17.3% |
| Jamaicans | 0.3 /100 | #266 | Tragic 17.3% |
| Haitians | 0.3 /100 | #267 | Tragic 17.3% |
| Immigrants | Caribbean | 0.3 /100 | #268 | Tragic 17.4% |
| Slavs | 0.3 /100 | #269 | Tragic 17.4% |
| Indonesians | 0.2 /100 | #270 | Tragic 17.4% |
| French American Indians | 0.2 /100 | #271 | Tragic 17.4% |
Demographics Similar to Chileans by Single Father Poverty
In terms of single father poverty, the demographic groups most similar to Chileans are South American Indian (15.7%, a difference of 0.060%), Australian (15.7%, a difference of 0.080%), Immigrants from Australia (15.7%, a difference of 0.10%), Fijian (15.7%, a difference of 0.16%), and Immigrants from Poland (15.7%, a difference of 0.17%).
| Demographics | Rating | Rank | Single Father Poverty |
| Immigrants | Kazakhstan | 98.2 /100 | #95 | Exceptional 15.6% |
| Immigrants | Belgium | 98.1 /100 | #96 | Exceptional 15.6% |
| Yaqui | 98.1 /100 | #97 | Exceptional 15.6% |
| Zimbabweans | 98.1 /100 | #98 | Exceptional 15.6% |
| Immigrants | Middle Africa | 97.4 /100 | #99 | Exceptional 15.6% |
| Immigrants | Chile | 96.9 /100 | #100 | Exceptional 15.7% |
| Fijians | 96.8 /100 | #101 | Exceptional 15.7% |
| Chileans | 96.4 /100 | #102 | Exceptional 15.7% |
| South American Indians | 96.2 /100 | #103 | Exceptional 15.7% |
| Australians | 96.1 /100 | #104 | Exceptional 15.7% |
| Immigrants | Australia | 96.1 /100 | #105 | Exceptional 15.7% |
| Immigrants | Poland | 95.8 /100 | #106 | Exceptional 15.7% |
| Native Hawaiians | 95.8 /100 | #107 | Exceptional 15.7% |
| Pakistanis | 95.7 /100 | #108 | Exceptional 15.7% |
| Turks | 95.1 /100 | #109 | Exceptional 15.8% |