Slovene vs Immigrants from Israel Male Poverty
COMPARE
Slovene
Immigrants from Israel
Male Poverty
Male Poverty Comparison
Slovenes
Immigrants from Israel
10.0%
MALE POVERTY
98.8/ 100
METRIC RATING
49th/ 347
METRIC RANK
10.8%
MALE POVERTY
80.9/ 100
METRIC RATING
136th/ 347
METRIC RANK
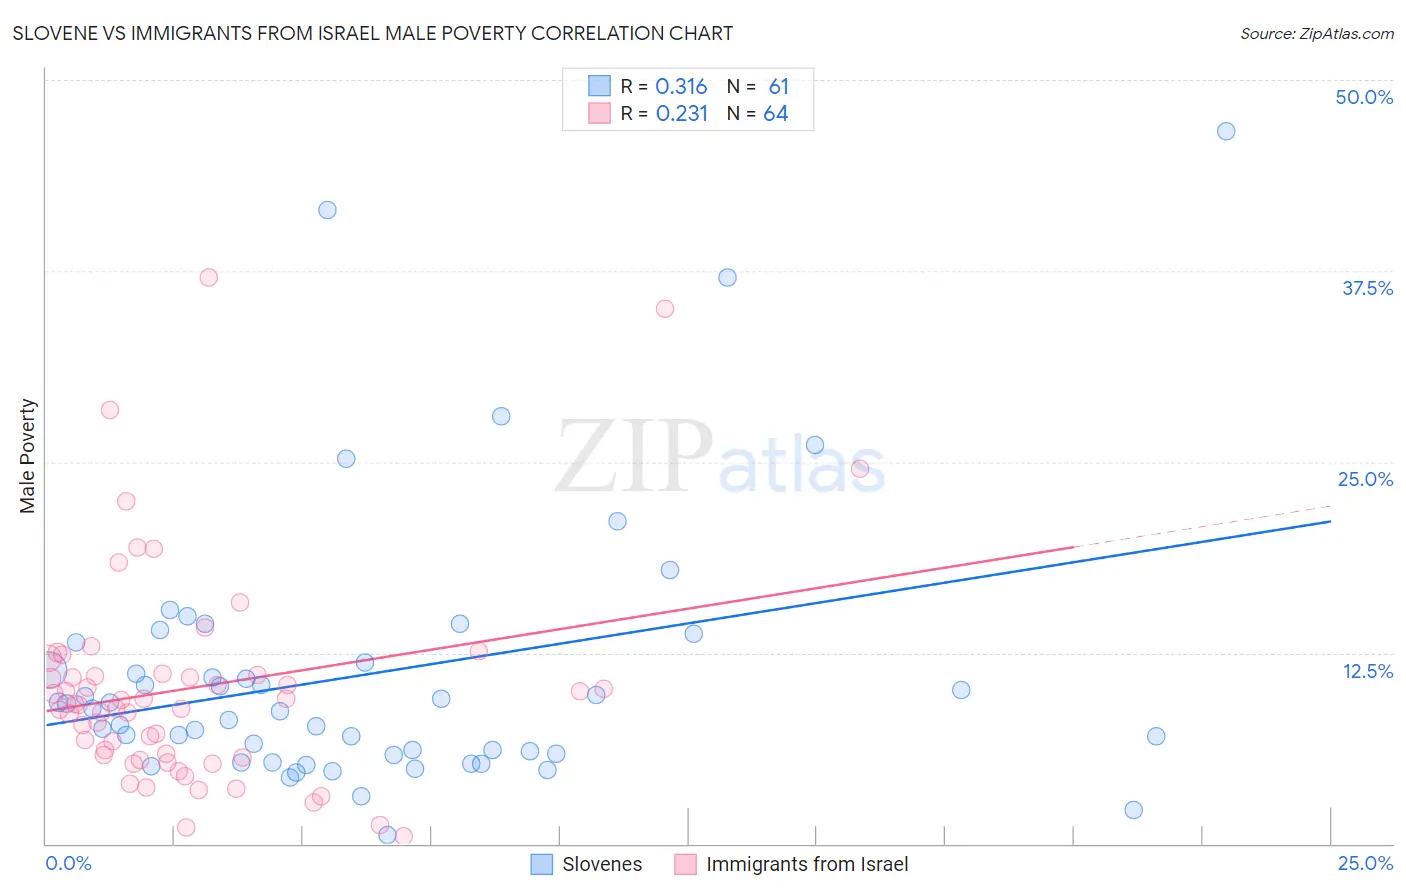
Slovene vs Immigrants from Israel Male Poverty Correlation Chart
The statistical analysis conducted on geographies consisting of 261,189,705 people shows a mild positive correlation between the proportion of Slovenes and poverty level among males in the United States with a correlation coefficient (R) of 0.316 and weighted average of 10.0%. Similarly, the statistical analysis conducted on geographies consisting of 209,930,227 people shows a weak positive correlation between the proportion of Immigrants from Israel and poverty level among males in the United States with a correlation coefficient (R) of 0.231 and weighted average of 10.8%, a difference of 8.1%.
Male Poverty Correlation Summary
| Measurement | Slovene | Immigrants from Israel |
| Minimum | 0.61% | 0.49% |
| Maximum | 46.7% | 37.1% |
| Range | 46.1% | 36.6% |
| Mean | 11.1% | 10.2% |
| Median | 8.8% | 9.1% |
| Interquartile 25% (IQ1) | 5.8% | 5.7% |
| Interquartile 75% (IQ3) | 12.5% | 11.1% |
| Interquartile Range (IQR) | 6.7% | 5.4% |
| Standard Deviation (Sample) | 8.9% | 7.1% |
| Standard Deviation (Population) | 8.8% | 7.0% |
Similar Demographics by Male Poverty
Demographics Similar to Slovenes by Male Poverty
In terms of male poverty, the demographic groups most similar to Slovenes are Immigrants from Philippines (10.0%, a difference of 0.050%), Immigrants from Singapore (10.0%, a difference of 0.090%), Immigrants from Japan (10.0%, a difference of 0.090%), Immigrants from Croatia (10.0%, a difference of 0.16%), and Turkish (10.0%, a difference of 0.23%).
| Demographics | Rating | Rank | Male Poverty |
| Immigrants | Iran | 99.1 /100 | #42 | Exceptional 9.9% |
| Immigrants | Moldova | 99.0 /100 | #43 | Exceptional 9.9% |
| Immigrants | Romania | 98.9 /100 | #44 | Exceptional 9.9% |
| Immigrants | Serbia | 98.9 /100 | #45 | Exceptional 10.0% |
| Turks | 98.9 /100 | #46 | Exceptional 10.0% |
| Immigrants | Singapore | 98.8 /100 | #47 | Exceptional 10.0% |
| Immigrants | Japan | 98.8 /100 | #48 | Exceptional 10.0% |
| Slovenes | 98.8 /100 | #49 | Exceptional 10.0% |
| Immigrants | Philippines | 98.7 /100 | #50 | Exceptional 10.0% |
| Immigrants | Croatia | 98.7 /100 | #51 | Exceptional 10.0% |
| Asians | 98.7 /100 | #52 | Exceptional 10.0% |
| Immigrants | Czechoslovakia | 98.6 /100 | #53 | Exceptional 10.0% |
| Immigrants | Austria | 98.5 /100 | #54 | Exceptional 10.0% |
| Germans | 98.3 /100 | #55 | Exceptional 10.1% |
| Immigrants | Bulgaria | 98.2 /100 | #56 | Exceptional 10.1% |
Demographics Similar to Immigrants from Israel by Male Poverty
In terms of male poverty, the demographic groups most similar to Immigrants from Israel are Immigrants from Switzerland (10.8%, a difference of 0.26%), Brazilian (10.8%, a difference of 0.31%), New Zealander (10.8%, a difference of 0.35%), Pakistani (10.8%, a difference of 0.36%), and Immigrants from Vietnam (10.8%, a difference of 0.37%).
| Demographics | Rating | Rank | Male Poverty |
| Immigrants | Peru | 84.1 /100 | #129 | Excellent 10.7% |
| Chileans | 83.9 /100 | #130 | Excellent 10.7% |
| Immigrants | Belarus | 83.3 /100 | #131 | Excellent 10.7% |
| Immigrants | Vietnam | 83.0 /100 | #132 | Excellent 10.8% |
| Pakistanis | 83.0 /100 | #133 | Excellent 10.8% |
| New Zealanders | 82.9 /100 | #134 | Excellent 10.8% |
| Brazilians | 82.7 /100 | #135 | Excellent 10.8% |
| Immigrants | Israel | 80.9 /100 | #136 | Excellent 10.8% |
| Immigrants | Switzerland | 79.2 /100 | #137 | Good 10.8% |
| Yugoslavians | 78.2 /100 | #138 | Good 10.8% |
| Immigrants | Jordan | 77.5 /100 | #139 | Good 10.8% |
| Tlingit-Haida | 76.1 /100 | #140 | Good 10.9% |
| Immigrants | France | 75.8 /100 | #141 | Good 10.9% |
| Basques | 74.6 /100 | #142 | Good 10.9% |
| Afghans | 71.9 /100 | #143 | Good 10.9% |