Canadian vs Immigrants from Israel Male Poverty
COMPARE
Canadian
Immigrants from Israel
Male Poverty
Male Poverty Comparison
Canadians
Immigrants from Israel
10.5%
MALE POVERTY
91.6/ 100
METRIC RATING
105th/ 347
METRIC RANK
10.8%
MALE POVERTY
80.9/ 100
METRIC RATING
136th/ 347
METRIC RANK
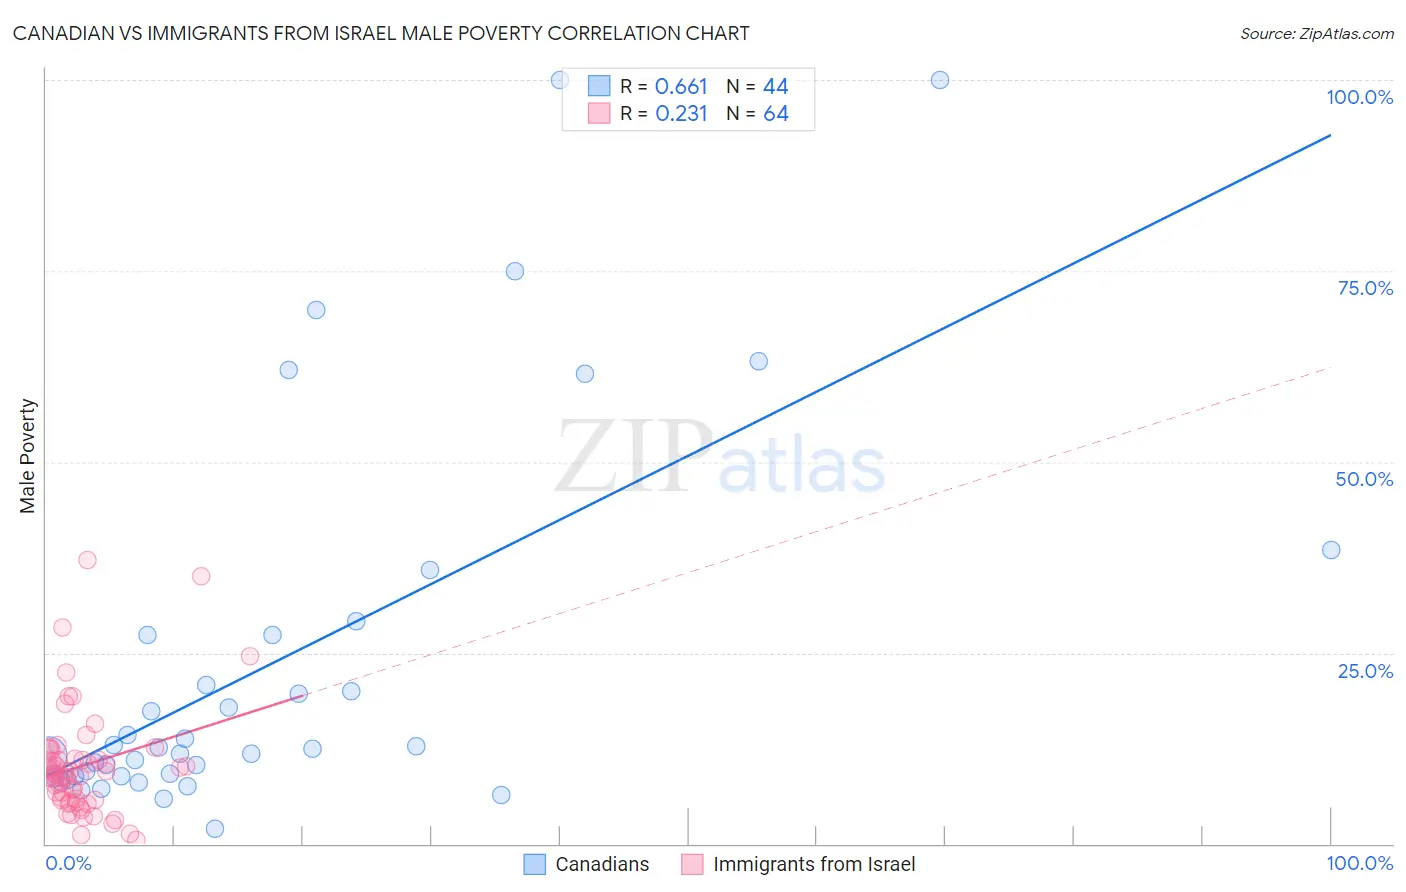
Canadian vs Immigrants from Israel Male Poverty Correlation Chart
The statistical analysis conducted on geographies consisting of 437,032,660 people shows a significant positive correlation between the proportion of Canadians and poverty level among males in the United States with a correlation coefficient (R) of 0.661 and weighted average of 10.5%. Similarly, the statistical analysis conducted on geographies consisting of 209,930,227 people shows a weak positive correlation between the proportion of Immigrants from Israel and poverty level among males in the United States with a correlation coefficient (R) of 0.231 and weighted average of 10.8%, a difference of 2.5%.
Male Poverty Correlation Summary
| Measurement | Canadian | Immigrants from Israel |
| Minimum | 2.0% | 0.49% |
| Maximum | 100.0% | 37.1% |
| Range | 98.0% | 36.6% |
| Mean | 23.8% | 10.2% |
| Median | 12.5% | 9.1% |
| Interquartile 25% (IQ1) | 8.8% | 5.7% |
| Interquartile 75% (IQ3) | 27.3% | 11.1% |
| Interquartile Range (IQR) | 18.5% | 5.4% |
| Standard Deviation (Sample) | 25.0% | 7.1% |
| Standard Deviation (Population) | 24.7% | 7.0% |
Similar Demographics by Male Poverty
Demographics Similar to Canadians by Male Poverty
In terms of male poverty, the demographic groups most similar to Canadians are Welsh (10.5%, a difference of 0.010%), Slavic (10.5%, a difference of 0.020%), Immigrants from Southern Europe (10.5%, a difference of 0.11%), French Canadian (10.5%, a difference of 0.12%), and Laotian (10.5%, a difference of 0.12%).
| Demographics | Rating | Rank | Male Poverty |
| Finns | 93.4 /100 | #98 | Exceptional 10.5% |
| Immigrants | Indonesia | 93.3 /100 | #99 | Exceptional 10.5% |
| Immigrants | Latvia | 92.8 /100 | #100 | Exceptional 10.5% |
| Immigrants | Zimbabwe | 92.0 /100 | #101 | Exceptional 10.5% |
| French Canadians | 91.9 /100 | #102 | Exceptional 10.5% |
| Slavs | 91.7 /100 | #103 | Exceptional 10.5% |
| Welsh | 91.6 /100 | #104 | Exceptional 10.5% |
| Canadians | 91.6 /100 | #105 | Exceptional 10.5% |
| Immigrants | Southern Europe | 91.3 /100 | #106 | Exceptional 10.5% |
| Laotians | 91.2 /100 | #107 | Exceptional 10.5% |
| Portuguese | 91.0 /100 | #108 | Exceptional 10.6% |
| Albanians | 90.6 /100 | #109 | Exceptional 10.6% |
| Argentineans | 90.1 /100 | #110 | Exceptional 10.6% |
| Immigrants | Argentina | 89.8 /100 | #111 | Excellent 10.6% |
| Immigrants | Turkey | 89.5 /100 | #112 | Excellent 10.6% |
Demographics Similar to Immigrants from Israel by Male Poverty
In terms of male poverty, the demographic groups most similar to Immigrants from Israel are Immigrants from Switzerland (10.8%, a difference of 0.26%), Brazilian (10.8%, a difference of 0.31%), New Zealander (10.8%, a difference of 0.35%), Pakistani (10.8%, a difference of 0.36%), and Immigrants from Vietnam (10.8%, a difference of 0.37%).
| Demographics | Rating | Rank | Male Poverty |
| Immigrants | Peru | 84.1 /100 | #129 | Excellent 10.7% |
| Chileans | 83.9 /100 | #130 | Excellent 10.7% |
| Immigrants | Belarus | 83.3 /100 | #131 | Excellent 10.7% |
| Immigrants | Vietnam | 83.0 /100 | #132 | Excellent 10.8% |
| Pakistanis | 83.0 /100 | #133 | Excellent 10.8% |
| New Zealanders | 82.9 /100 | #134 | Excellent 10.8% |
| Brazilians | 82.7 /100 | #135 | Excellent 10.8% |
| Immigrants | Israel | 80.9 /100 | #136 | Excellent 10.8% |
| Immigrants | Switzerland | 79.2 /100 | #137 | Good 10.8% |
| Yugoslavians | 78.2 /100 | #138 | Good 10.8% |
| Immigrants | Jordan | 77.5 /100 | #139 | Good 10.8% |
| Tlingit-Haida | 76.1 /100 | #140 | Good 10.9% |
| Immigrants | France | 75.8 /100 | #141 | Good 10.9% |
| Basques | 74.6 /100 | #142 | Good 10.9% |
| Afghans | 71.9 /100 | #143 | Good 10.9% |