Slovene vs Immigrants from Europe Male Poverty
COMPARE
Slovene
Immigrants from Europe
Male Poverty
Male Poverty Comparison
Slovenes
Immigrants from Europe
10.0%
MALE POVERTY
98.8/ 100
METRIC RATING
49th/ 347
METRIC RANK
10.1%
MALE POVERTY
97.9/ 100
METRIC RATING
59th/ 347
METRIC RANK
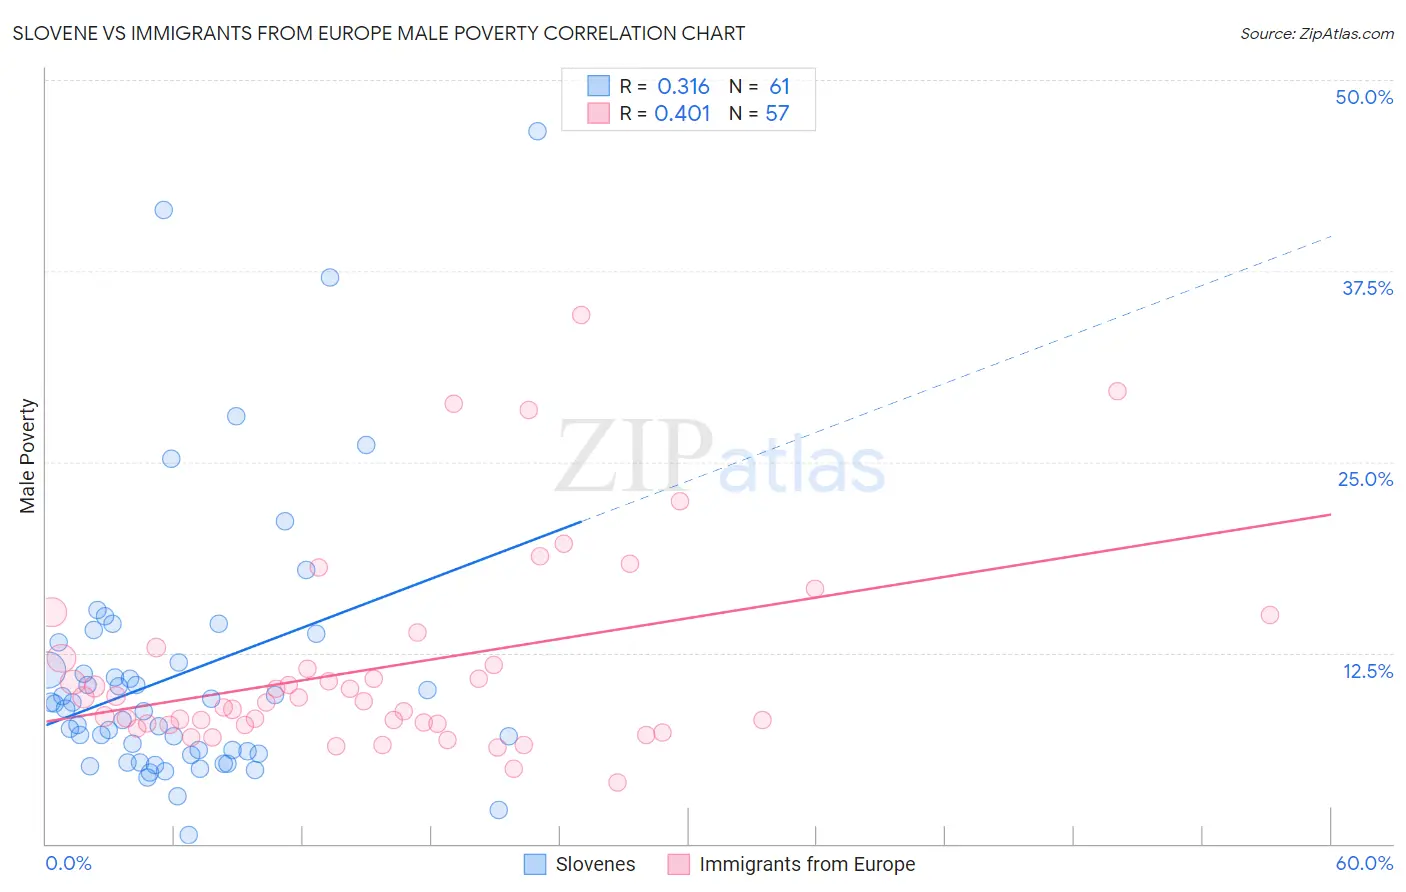
Slovene vs Immigrants from Europe Male Poverty Correlation Chart
The statistical analysis conducted on geographies consisting of 261,189,705 people shows a mild positive correlation between the proportion of Slovenes and poverty level among males in the United States with a correlation coefficient (R) of 0.316 and weighted average of 10.0%. Similarly, the statistical analysis conducted on geographies consisting of 546,187,630 people shows a moderate positive correlation between the proportion of Immigrants from Europe and poverty level among males in the United States with a correlation coefficient (R) of 0.401 and weighted average of 10.1%, a difference of 1.5%.
Male Poverty Correlation Summary
| Measurement | Slovene | Immigrants from Europe |
| Minimum | 0.61% | 4.0% |
| Maximum | 46.7% | 34.6% |
| Range | 46.1% | 30.6% |
| Mean | 11.1% | 11.6% |
| Median | 8.8% | 9.3% |
| Interquartile 25% (IQ1) | 5.8% | 7.8% |
| Interquartile 75% (IQ3) | 12.5% | 12.5% |
| Interquartile Range (IQR) | 6.7% | 4.7% |
| Standard Deviation (Sample) | 8.9% | 6.5% |
| Standard Deviation (Population) | 8.8% | 6.4% |
Demographics Similar to Slovenes and Immigrants from Europe by Male Poverty
In terms of male poverty, the demographic groups most similar to Slovenes are Immigrants from Philippines (10.0%, a difference of 0.050%), Immigrants from Singapore (10.0%, a difference of 0.090%), Immigrants from Japan (10.0%, a difference of 0.090%), Immigrants from Croatia (10.0%, a difference of 0.16%), and Turkish (10.0%, a difference of 0.23%). Similarly, the demographic groups most similar to Immigrants from Europe are Ukrainian (10.1%, a difference of 0.090%), Austrian (10.1%, a difference of 0.11%), Scandinavian (10.1%, a difference of 0.13%), Immigrants from Italy (10.2%, a difference of 0.20%), and Estonian (10.1%, a difference of 0.21%).
| Demographics | Rating | Rank | Male Poverty |
| Immigrants | Romania | 98.9 /100 | #44 | Exceptional 9.9% |
| Immigrants | Serbia | 98.9 /100 | #45 | Exceptional 10.0% |
| Turks | 98.9 /100 | #46 | Exceptional 10.0% |
| Immigrants | Singapore | 98.8 /100 | #47 | Exceptional 10.0% |
| Immigrants | Japan | 98.8 /100 | #48 | Exceptional 10.0% |
| Slovenes | 98.8 /100 | #49 | Exceptional 10.0% |
| Immigrants | Philippines | 98.7 /100 | #50 | Exceptional 10.0% |
| Immigrants | Croatia | 98.7 /100 | #51 | Exceptional 10.0% |
| Asians | 98.7 /100 | #52 | Exceptional 10.0% |
| Immigrants | Czechoslovakia | 98.6 /100 | #53 | Exceptional 10.0% |
| Immigrants | Austria | 98.5 /100 | #54 | Exceptional 10.0% |
| Germans | 98.3 /100 | #55 | Exceptional 10.1% |
| Immigrants | Bulgaria | 98.2 /100 | #56 | Exceptional 10.1% |
| Estonians | 98.1 /100 | #57 | Exceptional 10.1% |
| Scandinavians | 98.0 /100 | #58 | Exceptional 10.1% |
| Immigrants | Europe | 97.9 /100 | #59 | Exceptional 10.1% |
| Ukrainians | 97.9 /100 | #60 | Exceptional 10.1% |
| Austrians | 97.8 /100 | #61 | Exceptional 10.1% |
| Immigrants | Italy | 97.8 /100 | #62 | Exceptional 10.2% |
| Slovaks | 97.7 /100 | #63 | Exceptional 10.2% |
| Swiss | 97.5 /100 | #64 | Exceptional 10.2% |