Arab vs Immigrants from Israel Male Poverty

COMPARE

Arab
Race
Ancestry
AfghanAfricanAlaska NativeAlaskan AthabascanAlbanianAleutAlsatianAmericanApacheArabArapahoArgentineanArmenianAssyrian/Chaldean/SyriacAustralianAustrianBahamianBangladeshiBarbadianBasqueBelgianBelizeanBermudanBhutaneseBlackfeetBolivianBrazilianBritishBritish West IndianBulgarianBurmeseCajunCambodianCanadianCape VerdeanCarpatho RusynCelticCentral AmericanCentral American IndianCherokeeCheyenneChickasawChileanChineseChippewaChoctawColombianColvilleComancheCosta RicanCreeCreekCroatianCrowCubanCypriotCzechCzechoslovakianDanishDelawareDominicanDutchDutch West IndianEastern EuropeanEcuadorianEgyptianEnglishEstonianEthiopianEuropeanFijianFilipinoFinnishFrenchFrench American IndianFrench CanadianGermanGerman RussianGhanaianGreekGuamanian/ChamorroGuatemalanGuyaneseHaitianHmongHonduranHopiHoumaHungarianIcelanderIndian (Asian)IndonesianInupiatIranianIraqiIrishIroquoisIsraeliItalianJamaicanJapaneseJordanianKenyanKiowaKoreanLaotianLatvianLebaneseLiberianLithuanianLumbeeLuxembourgerMacedonianMalaysianMalteseMarshalleseMenomineeMexicanMexican American IndianMongolianMoroccanNative HawaiianNavajoNepaleseNew ZealanderNicaraguanNigerianNorthern EuropeanNorwegianOkinawanOsageOttawaPaiutePakistaniPalestinianPanamanianParaguayanPennsylvania GermanPeruvianPimaPolishPortuguesePotawatomiPuebloPuerto RicanPuget Sound SalishRomanianRussianSalvadoranSamoanScandinavianScotch-IrishScottishSeminoleSenegaleseSerbianShoshoneSierra LeoneanSiouxSlavicSlovakSloveneSomaliSouth AfricanSouth AmericanSouth American IndianSoviet UnionSpaniardSpanishSpanish AmericanSpanish American IndianSri LankanSubsaharan AfricanSudaneseSwedishSwissSyrianTaiwaneseThaiTlingit-HaidaTohono O'OdhamTonganTrinidadian and TobagonianTsimshianTurkishU.S. Virgin IslanderUgandanUkrainianUruguayanUteVenezuelanVietnameseWelshWest IndianYakamaYaquiYugoslavianYumanYup'ikZimbabwean
Immigration
NonimmigrantsImmigrantsAfghanistanAfricaAlbaniaArgentinaArmeniaAsiaAustraliaAustriaBahamasBangladeshBarbadosBelarusBelgiumBelizeBoliviaBosnia and HerzegovinaBrazilBulgariaBurma/MyanmarCabo VerdeCambodiaCameroonCanadaCaribbeanCentral AmericaChileChinaColombiaCongoCosta RicaCroatiaCubaCzechoslovakiaDenmarkDominicaDominican RepublicEastern AfricaEastern AsiaEastern EuropeEcuadorEgyptEl SalvadorEnglandEritreaEthiopiaEuropeFijiFranceGermanyGhanaGreeceGrenadaGuatemalaGuyanaHaitiHondurasHong KongHungaryIndiaIndonesiaIranIraqIrelandItalyJamaicaJapanJordanKazakhstanKenyaKoreaKuwaitLaosLatin AmericaLatviaLebanonLiberiaLithuaniaMalaysiaMexicoMicronesiaMiddle AfricaMoldovaMoroccoNepalNetherlandsNicaraguaNigeriaNorth AmericaNorth MacedoniaNorthern AfricaNorthern EuropeNorwayOceaniaPakistanPanamaPeruPhilippinesPolandPortugalRomaniaRussiaSaudi ArabiaScotlandSenegalSerbiaSierra LeoneSingaporeSomaliaSouth AfricaSouth AmericaSouth Central AsiaSouth Eastern AsiaSouthern EuropeSpainSri LankaSt. Vincent and the GrenadinesSudanSwedenSwitzerlandSyriaTaiwanThailandTrinidad and TobagoTurkeyUgandaUkraineUruguayUzbekistanVenezuelaVietnamWest IndiesWestern AfricaWestern AsiaWestern EuropeYemenZaireZimbabweAzores
Immigrants from Israel
Race
Ancestry
AfghanAfricanAlaska NativeAlaskan AthabascanAlbanianAleutAlsatianAmericanApacheArapahoArgentineanArmenianAssyrian/Chaldean/SyriacAustralianAustrianBahamianBangladeshiBarbadianBasqueBelgianBelizeanBermudanBhutaneseBlackfeetBolivianBrazilianBritishBritish West IndianBulgarianBurmeseCajunCambodianCanadianCape VerdeanCarpatho RusynCelticCentral AmericanCentral American IndianCherokeeCheyenneChickasawChileanChineseChippewaChoctawColombianColvilleComancheCosta RicanCreeCreekCroatianCrowCubanCypriotCzechCzechoslovakianDanishDelawareDominicanDutchDutch West IndianEastern EuropeanEcuadorianEgyptianEnglishEstonianEthiopianEuropeanFijianFilipinoFinnishFrenchFrench American IndianFrench CanadianGermanGerman RussianGhanaianGreekGuamanian/ChamorroGuatemalanGuyaneseHaitianHmongHonduranHopiHoumaHungarianIcelanderIndian (Asian)IndonesianInupiatIranianIraqiIrishIroquoisIsraeliItalianJamaicanJapaneseJordanianKenyanKiowaKoreanLaotianLatvianLebaneseLiberianLithuanianLumbeeLuxembourgerMacedonianMalaysianMalteseMarshalleseMenomineeMexicanMexican American IndianMongolianMoroccanNative HawaiianNavajoNepaleseNew ZealanderNicaraguanNigerianNorthern EuropeanNorwegianOkinawanOsageOttawaPaiutePakistaniPalestinianPanamanianParaguayanPennsylvania GermanPeruvianPimaPolishPortuguesePotawatomiPuebloPuerto RicanPuget Sound SalishRomanianRussianSalvadoranSamoanScandinavianScotch-IrishScottishSeminoleSenegaleseSerbianShoshoneSierra LeoneanSiouxSlavicSlovakSloveneSomaliSouth AfricanSouth AmericanSouth American IndianSoviet UnionSpaniardSpanishSpanish AmericanSpanish American IndianSri LankanSubsaharan AfricanSudaneseSwedishSwissSyrianTaiwaneseThaiTlingit-HaidaTohono O'OdhamTonganTrinidadian and TobagonianTsimshianTurkishU.S. Virgin IslanderUgandanUkrainianUruguayanUteVenezuelanVietnameseWelshWest IndianYakamaYaquiYugoslavianYumanYup'ikZimbabwean
Immigration
NonimmigrantsImmigrantsAfghanistanAfricaAlbaniaArgentinaArmeniaAsiaAustraliaAustriaBahamasBangladeshBarbadosBelarusBelgiumBelizeBoliviaBosnia and HerzegovinaBrazilBulgariaBurma/MyanmarCabo VerdeCambodiaCameroonCanadaCaribbeanCentral AmericaChileChinaColombiaCongoCosta RicaCroatiaCubaCzechoslovakiaDenmarkDominicaDominican RepublicEastern AfricaEastern AsiaEastern EuropeEcuadorEgyptEl SalvadorEnglandEritreaEthiopiaEuropeFijiFranceGermanyGhanaGreeceGrenadaGuatemalaGuyanaHaitiHondurasHong KongHungaryIndiaIndonesiaIranIraqIrelandIsraelItalyJamaicaJapanJordanKazakhstanKenyaKoreaKuwaitLaosLatin AmericaLatviaLebanonLiberiaLithuaniaMalaysiaMexicoMicronesiaMiddle AfricaMoldovaMoroccoNepalNetherlandsNicaraguaNigeriaNorth AmericaNorth MacedoniaNorthern AfricaNorthern EuropeNorwayOceaniaPakistanPanamaPeruPhilippinesPolandPortugalRomaniaRussiaSaudi ArabiaScotlandSenegalSerbiaSierra LeoneSingaporeSomaliaSouth AfricaSouth AmericaSouth Central AsiaSouth Eastern AsiaSouthern EuropeSpainSri LankaSt. Vincent and the GrenadinesSudanSwedenSwitzerlandSyriaTaiwanThailandTrinidad and TobagoTurkeyUgandaUkraineUruguayUzbekistanVenezuelaVietnamWest IndiesWestern AfricaWestern AsiaWestern EuropeYemenZaireZimbabweAzores
Male Poverty
Income
Poverty
Unemployment
Labor Participation
Family Structure
Vehicle Availability
Education Level
Disability

Male Poverty Comparison

Arabs

Immigrants from Israel

Poor
Excellent
11.6%
MALE POVERTY
15.8/ 100
METRIC RATING
195th/ 347
METRIC RANK
10.8%
MALE POVERTY
80.9/ 100
METRIC RATING
136th/ 347
METRIC RANK

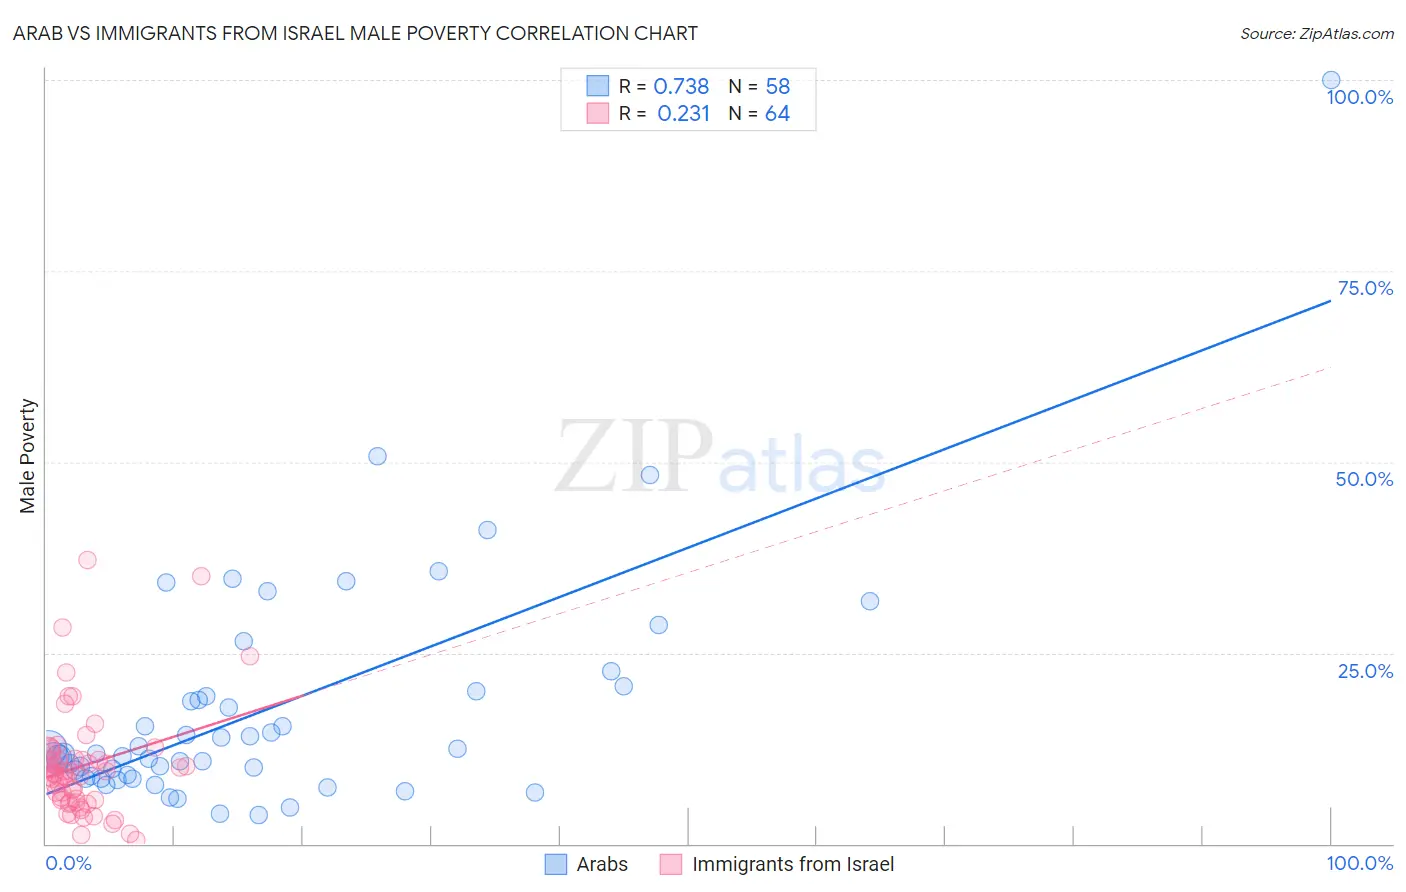
Arab vs Immigrants from Israel Male Poverty Correlation Chart

The statistical analysis conducted on geographies consisting of 486,080,100 people shows a strong positive correlation between the proportion of Arabs and poverty level among males in the United States with a correlation coefficient (R) of 0.738 and weighted average of 11.6%. Similarly, the statistical analysis conducted on geographies consisting of 209,930,227 people shows a weak positive correlation between the proportion of Immigrants from Israel and poverty level among males in the United States with a correlation coefficient (R) of 0.231 and weighted average of 10.8%, a difference of 7.9%.
Arab vs Immigrants from Israel Male Poverty

Male Poverty Correlation Summary

MeasurementArabImmigrants from Israel
Minimum3.8%0.49%
Maximum100.0%37.1%
Range96.2%36.6%
Mean17.7%10.2%
Median11.7%9.1%
Interquartile 25% (IQ1)8.8%5.7%
Interquartile 75% (IQ3)20.0%11.1%
Interquartile Range (IQR)11.2%5.4%
Standard Deviation (Sample)15.6%7.1%
Standard Deviation (Population)15.5%7.0%

Similar Demographics by Male Poverty

Demographics Similar to Arabs by Male Poverty

In terms of male poverty, the demographic groups most similar to Arabs are Hmong (11.6%, a difference of 0.010%), Immigrants from Kenya (11.6%, a difference of 0.050%), Delaware (11.7%, a difference of 0.070%), Iraqi (11.7%, a difference of 0.21%), and Immigrants from Kuwait (11.6%, a difference of 0.26%).
DemographicsRating | RankMale Poverty
Sierra Leoneans
29.9
/100
|
#188
Fair
11.4%
Hawaiians
28.3
/100
|
#189
Fair
11.4%
Israelis
26.1
/100
|
#190
Fair
11.5%
South American Indians
22.8
/100
|
#191
Fair
11.5%
Immigrants | Uruguay
19.1
/100
|
#192
Poor
11.6%
Immigrants | Kuwait
17.3
/100
|
#193
Poor
11.6%
Immigrants | Kenya
16.1
/100
|
#194
Poor
11.6%
Arabs
15.8
/100
|
#195
Poor
11.6%
Hmong
15.8
/100
|
#196
Poor
11.6%
Delaware
15.4
/100
|
#197
Poor
11.7%
Iraqis
14.7
/100
|
#198
Poor
11.7%
Spanish
14.1
/100
|
#199
Poor
11.7%
Immigrants | Lebanon
13.6
/100
|
#200
Poor
11.7%
Spaniards
13.5
/100
|
#201
Poor
11.7%
Aleuts
10.4
/100
|
#202
Poor
11.8%

Demographics Similar to Immigrants from Israel by Male Poverty

In terms of male poverty, the demographic groups most similar to Immigrants from Israel are Immigrants from Switzerland (10.8%, a difference of 0.26%), Brazilian (10.8%, a difference of 0.31%), New Zealander (10.8%, a difference of 0.35%), Pakistani (10.8%, a difference of 0.36%), and Immigrants from Vietnam (10.8%, a difference of 0.37%).
DemographicsRating | RankMale Poverty
Immigrants | Peru
84.1
/100
|
#129
Excellent
10.7%
Chileans
83.9
/100
|
#130
Excellent
10.7%
Immigrants | Belarus
83.3
/100
|
#131
Excellent
10.7%
Immigrants | Vietnam
83.0
/100
|
#132
Excellent
10.8%
Pakistanis
83.0
/100
|
#133
Excellent
10.8%
New Zealanders
82.9
/100
|
#134
Excellent
10.8%
Brazilians
82.7
/100
|
#135
Excellent
10.8%
Immigrants | Israel
80.9
/100
|
#136
Excellent
10.8%
Immigrants | Switzerland
79.2
/100
|
#137
Good
10.8%
Yugoslavians
78.2
/100
|
#138
Good
10.8%
Immigrants | Jordan
77.5
/100
|
#139
Good
10.8%
Tlingit-Haida
76.1
/100
|
#140
Good
10.9%
Immigrants | France
75.8
/100
|
#141
Good
10.9%
Basques
74.6
/100
|
#142
Good
10.9%
Afghans
71.9
/100
|
#143
Good
10.9%