Slovak vs Senegalese Single Father Poverty
COMPARE
Slovak
Senegalese
Single Father Poverty
Single Father Poverty Comparison
Slovaks
Senegalese
19.3%
SINGLE FATHER POVERTY
0.0/ 100
METRIC RATING
319th/ 347
METRIC RANK
16.9%
SINGLE FATHER POVERTY
3.2/ 100
METRIC RATING
233rd/ 347
METRIC RANK
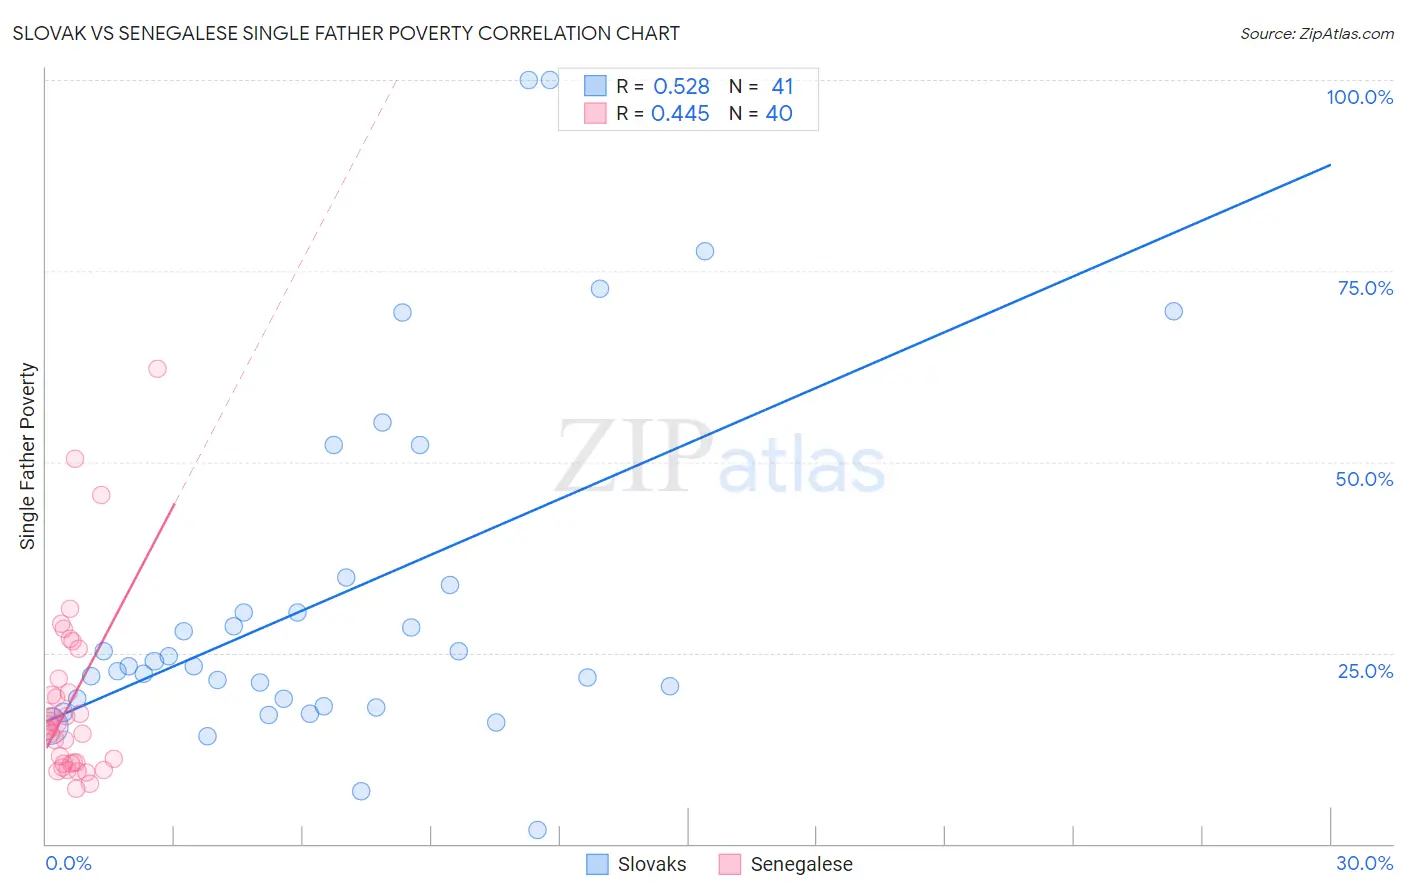
Slovak vs Senegalese Single Father Poverty Correlation Chart
The statistical analysis conducted on geographies consisting of 302,741,253 people shows a substantial positive correlation between the proportion of Slovaks and poverty level among single fathers in the United States with a correlation coefficient (R) of 0.528 and weighted average of 19.3%. Similarly, the statistical analysis conducted on geographies consisting of 73,350,667 people shows a moderate positive correlation between the proportion of Senegalese and poverty level among single fathers in the United States with a correlation coefficient (R) of 0.445 and weighted average of 16.9%, a difference of 14.1%.
Single Father Poverty Correlation Summary
| Measurement | Slovak | Senegalese |
| Minimum | 1.8% | 7.1% |
| Maximum | 100.0% | 62.2% |
| Range | 98.2% | 55.1% |
| Mean | 32.6% | 18.6% |
| Median | 23.2% | 15.2% |
| Interquartile 25% (IQ1) | 18.5% | 10.5% |
| Interquartile 75% (IQ3) | 34.3% | 20.7% |
| Interquartile Range (IQR) | 15.8% | 10.1% |
| Standard Deviation (Sample) | 23.5% | 11.8% |
| Standard Deviation (Population) | 23.2% | 11.7% |
Similar Demographics by Single Father Poverty
Demographics Similar to Slovaks by Single Father Poverty
In terms of single father poverty, the demographic groups most similar to Slovaks are Dutch West Indian (19.2%, a difference of 0.52%), Inupiat (19.5%, a difference of 0.91%), Dominican (19.1%, a difference of 1.1%), Osage (19.0%, a difference of 1.4%), and Cherokee (19.6%, a difference of 1.8%).
| Demographics | Rating | Rank | Single Father Poverty |
| Immigrants | Dominica | 0.0 /100 | #312 | Tragic 18.9% |
| Potawatomi | 0.0 /100 | #313 | Tragic 18.9% |
| Delaware | 0.0 /100 | #314 | Tragic 18.9% |
| Chickasaw | 0.0 /100 | #315 | Tragic 19.0% |
| Osage | 0.0 /100 | #316 | Tragic 19.0% |
| Dominicans | 0.0 /100 | #317 | Tragic 19.1% |
| Dutch West Indians | 0.0 /100 | #318 | Tragic 19.2% |
| Slovaks | 0.0 /100 | #319 | Tragic 19.3% |
| Inupiat | 0.0 /100 | #320 | Tragic 19.5% |
| Cherokee | 0.0 /100 | #321 | Tragic 19.6% |
| Creek | 0.0 /100 | #322 | Tragic 19.8% |
| Pennsylvania Germans | 0.0 /100 | #323 | Tragic 20.0% |
| Americans | 0.0 /100 | #324 | Tragic 20.1% |
| Blacks/African Americans | 0.0 /100 | #325 | Tragic 20.4% |
| Immigrants | Yemen | 0.0 /100 | #326 | Tragic 20.6% |
Demographics Similar to Senegalese by Single Father Poverty
In terms of single father poverty, the demographic groups most similar to Senegalese are Marshallese (16.9%, a difference of 0.030%), Immigrants from Western Europe (16.9%, a difference of 0.12%), Immigrants from Germany (16.9%, a difference of 0.12%), Subsaharan African (16.9%, a difference of 0.13%), and Immigrants from Grenada (16.9%, a difference of 0.14%).
| Demographics | Rating | Rank | Single Father Poverty |
| Hispanics or Latinos | 6.1 /100 | #226 | Tragic 16.8% |
| British | 5.6 /100 | #227 | Tragic 16.8% |
| Belgians | 5.3 /100 | #228 | Tragic 16.8% |
| Israelis | 4.6 /100 | #229 | Tragic 16.8% |
| Immigrants | Trinidad and Tobago | 4.5 /100 | #230 | Tragic 16.8% |
| Spanish Americans | 3.7 /100 | #231 | Tragic 16.9% |
| Immigrants | Grenada | 3.7 /100 | #232 | Tragic 16.9% |
| Senegalese | 3.2 /100 | #233 | Tragic 16.9% |
| Marshallese | 3.1 /100 | #234 | Tragic 16.9% |
| Immigrants | Western Europe | 2.9 /100 | #235 | Tragic 16.9% |
| Immigrants | Germany | 2.9 /100 | #236 | Tragic 16.9% |
| Sub-Saharan Africans | 2.9 /100 | #237 | Tragic 16.9% |
| Immigrants | Saudi Arabia | 2.7 /100 | #238 | Tragic 16.9% |
| Bermudans | 2.6 /100 | #239 | Tragic 16.9% |
| Finns | 2.6 /100 | #240 | Tragic 16.9% |