Slovak vs Senegalese Per Capita Income
COMPARE
Slovak
Senegalese
Per Capita Income
Per Capita Income Comparison
Slovaks
Senegalese
$44,229
PER CAPITA INCOME
65.4/ 100
METRIC RATING
156th/ 347
METRIC RANK
$41,000
PER CAPITA INCOME
4.8/ 100
METRIC RATING
231st/ 347
METRIC RANK
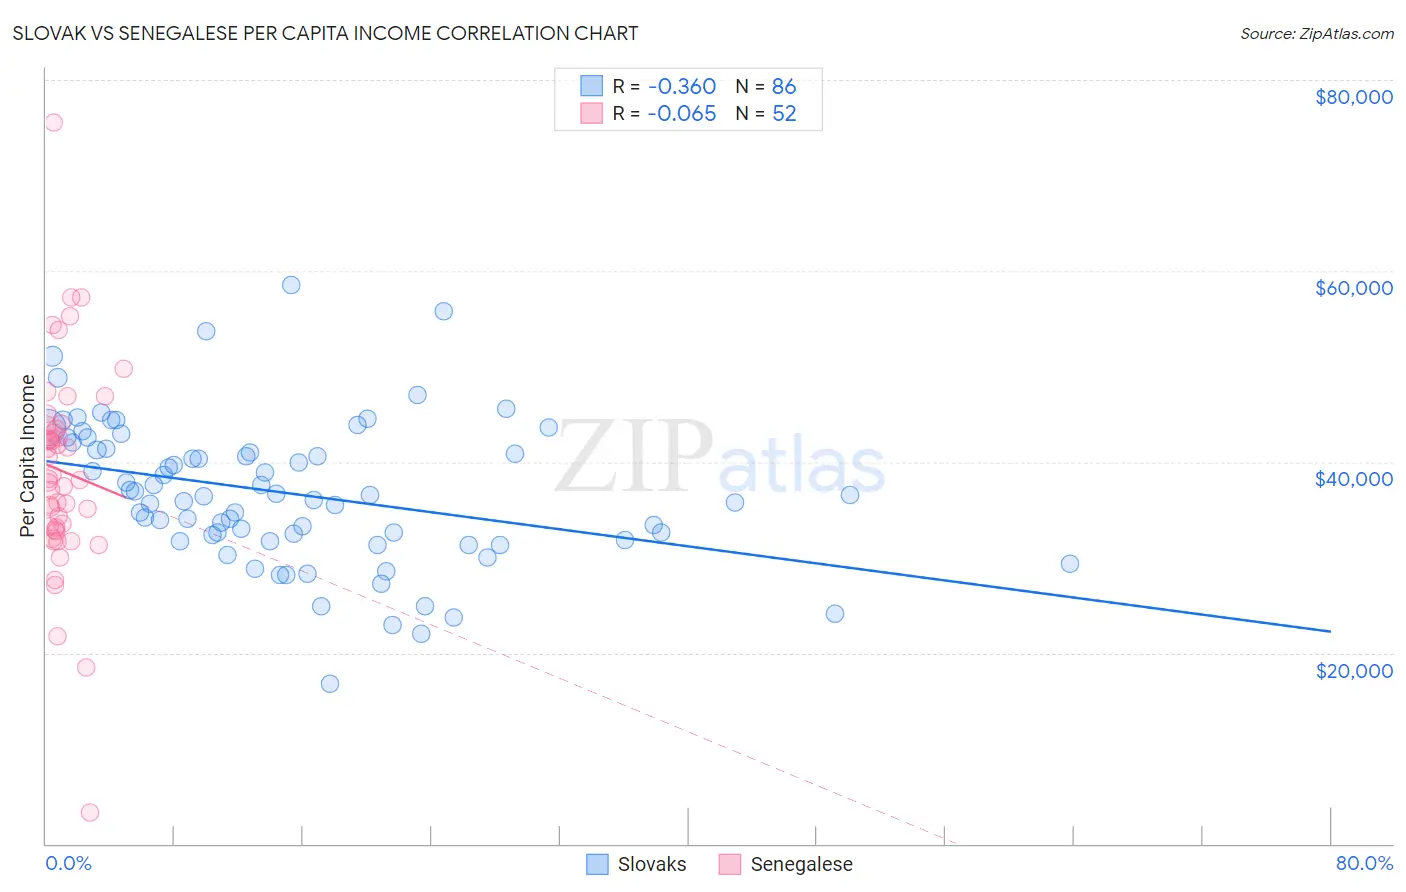
Slovak vs Senegalese Per Capita Income Correlation Chart
The statistical analysis conducted on geographies consisting of 397,898,984 people shows a mild negative correlation between the proportion of Slovaks and per capita income in the United States with a correlation coefficient (R) of -0.360 and weighted average of $44,229. Similarly, the statistical analysis conducted on geographies consisting of 78,107,792 people shows a slight negative correlation between the proportion of Senegalese and per capita income in the United States with a correlation coefficient (R) of -0.065 and weighted average of $41,000, a difference of 7.9%.
Per Capita Income Correlation Summary
| Measurement | Slovak | Senegalese |
| Minimum | $16,734 | $3,219 |
| Maximum | $58,546 | $75,539 |
| Range | $41,812 | $72,320 |
| Mean | $36,677 | $39,064 |
| Median | $36,437 | $38,147 |
| Interquartile 25% (IQ1) | $31,763 | $33,014 |
| Interquartile 75% (IQ3) | $41,360 | $43,632 |
| Interquartile Range (IQR) | $9,597 | $10,618 |
| Standard Deviation (Sample) | $7,565 | $10,948 |
| Standard Deviation (Population) | $7,521 | $10,843 |
Similar Demographics by Per Capita Income
Demographics Similar to Slovaks by Per Capita Income
In terms of per capita income, the demographic groups most similar to Slovaks are South American Indian ($44,206, a difference of 0.050%), Immigrants from Nepal ($44,187, a difference of 0.090%), Uruguayan ($44,318, a difference of 0.20%), South American ($44,114, a difference of 0.26%), and Portuguese ($44,362, a difference of 0.30%).
| Demographics | Rating | Rank | Per Capita Income |
| Koreans | 72.5 /100 | #149 | Good $44,522 |
| Immigrants | Eritrea | 72.1 /100 | #150 | Good $44,509 |
| Norwegians | 71.5 /100 | #151 | Good $44,480 |
| Peruvians | 71.5 /100 | #152 | Good $44,479 |
| Scottish | 70.6 /100 | #153 | Good $44,440 |
| Portuguese | 68.7 /100 | #154 | Good $44,362 |
| Uruguayans | 67.6 /100 | #155 | Good $44,318 |
| Slovaks | 65.4 /100 | #156 | Good $44,229 |
| South American Indians | 64.8 /100 | #157 | Good $44,206 |
| Immigrants | Nepal | 64.3 /100 | #158 | Good $44,187 |
| South Americans | 62.4 /100 | #159 | Good $44,114 |
| Danes | 61.9 /100 | #160 | Good $44,095 |
| Costa Ricans | 61.8 /100 | #161 | Good $44,090 |
| Swiss | 61.4 /100 | #162 | Good $44,076 |
| Immigrants | South America | 61.2 /100 | #163 | Good $44,068 |
Demographics Similar to Senegalese by Per Capita Income
In terms of per capita income, the demographic groups most similar to Senegalese are Native Hawaiian ($41,017, a difference of 0.040%), Nigerian ($41,026, a difference of 0.060%), Guyanese ($40,949, a difference of 0.12%), Immigrants from Grenada ($41,123, a difference of 0.30%), and Immigrants from Ghana ($41,131, a difference of 0.32%).
| Demographics | Rating | Rank | Per Capita Income |
| Immigrants | St. Vincent and the Grenadines | 6.4 /100 | #224 | Tragic $41,270 |
| West Indians | 6.0 /100 | #225 | Tragic $41,217 |
| Immigrants | Ecuador | 5.9 /100 | #226 | Tragic $41,195 |
| Immigrants | Ghana | 5.5 /100 | #227 | Tragic $41,131 |
| Immigrants | Grenada | 5.5 /100 | #228 | Tragic $41,123 |
| Nigerians | 4.9 /100 | #229 | Tragic $41,026 |
| Native Hawaiians | 4.9 /100 | #230 | Tragic $41,017 |
| Senegalese | 4.8 /100 | #231 | Tragic $41,000 |
| Guyanese | 4.5 /100 | #232 | Tragic $40,949 |
| Delaware | 3.8 /100 | #233 | Tragic $40,778 |
| Immigrants | West Indies | 3.7 /100 | #234 | Tragic $40,763 |
| Immigrants | Guyana | 3.6 /100 | #235 | Tragic $40,742 |
| Immigrants | Nonimmigrants | 3.4 /100 | #236 | Tragic $40,669 |
| Immigrants | Cambodia | 2.6 /100 | #237 | Tragic $40,434 |
| Somalis | 2.4 /100 | #238 | Tragic $40,367 |