Russian vs Senegalese Single Father Poverty
COMPARE
Russian
Senegalese
Single Father Poverty
Single Father Poverty Comparison
Russians
Senegalese
16.4%
SINGLE FATHER POVERTY
30.1/ 100
METRIC RATING
188th/ 347
METRIC RANK
16.9%
SINGLE FATHER POVERTY
3.2/ 100
METRIC RATING
233rd/ 347
METRIC RANK
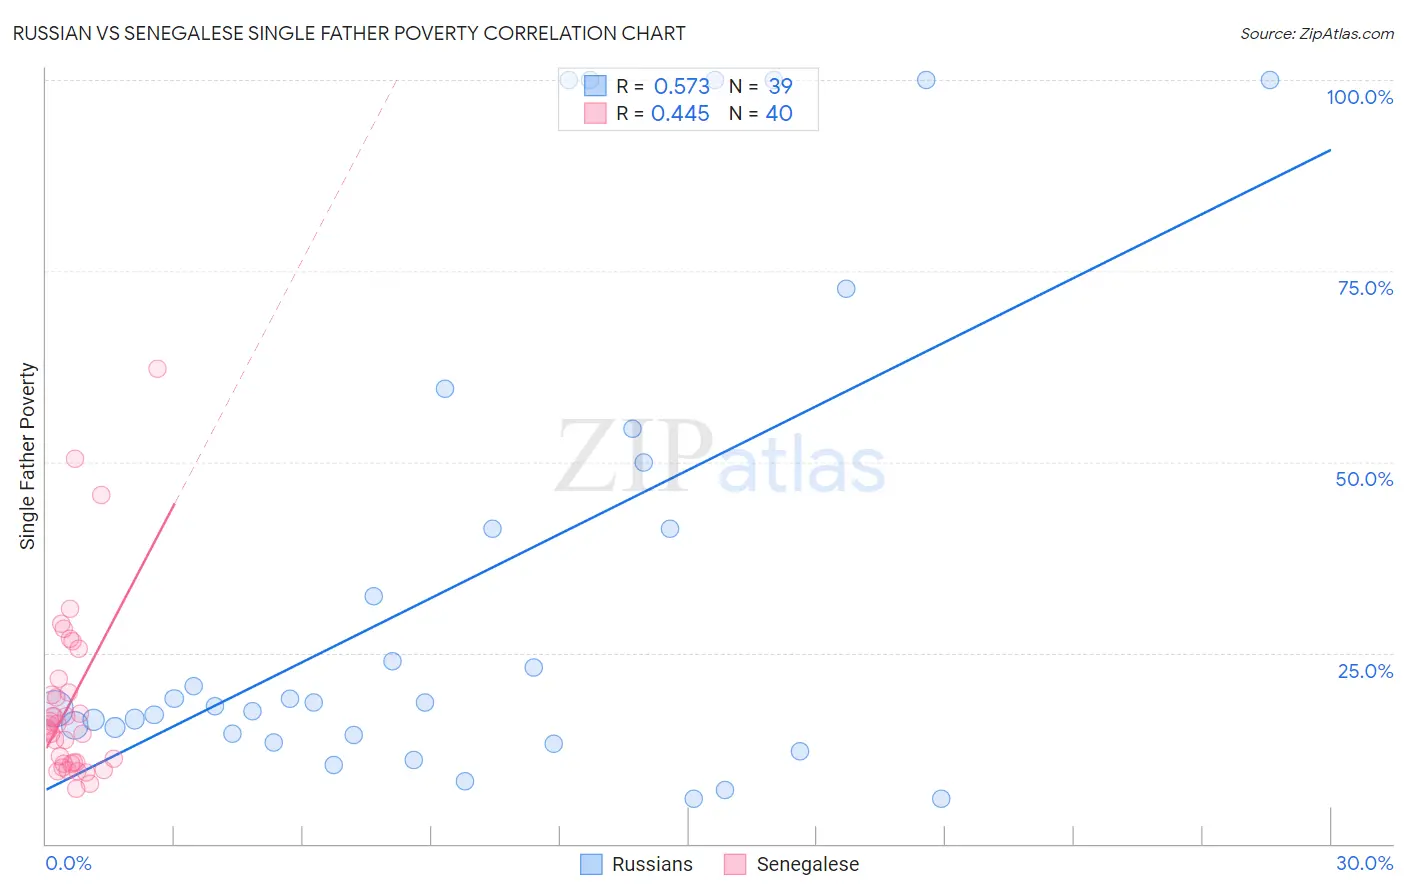
Russian vs Senegalese Single Father Poverty Correlation Chart
The statistical analysis conducted on geographies consisting of 378,661,966 people shows a substantial positive correlation between the proportion of Russians and poverty level among single fathers in the United States with a correlation coefficient (R) of 0.573 and weighted average of 16.4%. Similarly, the statistical analysis conducted on geographies consisting of 73,350,667 people shows a moderate positive correlation between the proportion of Senegalese and poverty level among single fathers in the United States with a correlation coefficient (R) of 0.445 and weighted average of 16.9%, a difference of 2.8%.
Single Father Poverty Correlation Summary
| Measurement | Russian | Senegalese |
| Minimum | 5.9% | 7.1% |
| Maximum | 100.0% | 62.2% |
| Range | 94.1% | 55.1% |
| Mean | 34.4% | 18.6% |
| Median | 18.4% | 15.2% |
| Interquartile 25% (IQ1) | 14.2% | 10.5% |
| Interquartile 75% (IQ3) | 50.0% | 20.7% |
| Interquartile Range (IQR) | 35.8% | 10.1% |
| Standard Deviation (Sample) | 32.0% | 11.8% |
| Standard Deviation (Population) | 31.6% | 11.7% |
Similar Demographics by Single Father Poverty
Demographics Similar to Russians by Single Father Poverty
In terms of single father poverty, the demographic groups most similar to Russians are Ukrainian (16.4%, a difference of 0.020%), Immigrants from Venezuela (16.4%, a difference of 0.050%), Latvian (16.5%, a difference of 0.060%), Immigrants from Burma/Myanmar (16.5%, a difference of 0.11%), and Immigrants from Guyana (16.5%, a difference of 0.16%).
| Demographics | Rating | Rank | Single Father Poverty |
| Immigrants | Western Africa | 36.0 /100 | #181 | Fair 16.4% |
| Immigrants | Italy | 35.7 /100 | #182 | Fair 16.4% |
| Aleuts | 35.3 /100 | #183 | Fair 16.4% |
| Cambodians | 34.6 /100 | #184 | Fair 16.4% |
| Panamanians | 33.6 /100 | #185 | Fair 16.4% |
| Immigrants | Venezuela | 31.0 /100 | #186 | Fair 16.4% |
| Ukrainians | 30.4 /100 | #187 | Fair 16.4% |
| Russians | 30.1 /100 | #188 | Fair 16.4% |
| Latvians | 28.9 /100 | #189 | Fair 16.5% |
| Immigrants | Burma/Myanmar | 28.0 /100 | #190 | Fair 16.5% |
| Immigrants | Guyana | 27.1 /100 | #191 | Fair 16.5% |
| Immigrants | Switzerland | 24.8 /100 | #192 | Fair 16.5% |
| Ecuadorians | 24.5 /100 | #193 | Fair 16.5% |
| Cape Verdeans | 24.4 /100 | #194 | Fair 16.5% |
| Immigrants | Barbados | 24.3 /100 | #195 | Fair 16.5% |
Demographics Similar to Senegalese by Single Father Poverty
In terms of single father poverty, the demographic groups most similar to Senegalese are Marshallese (16.9%, a difference of 0.030%), Immigrants from Western Europe (16.9%, a difference of 0.12%), Immigrants from Germany (16.9%, a difference of 0.12%), Subsaharan African (16.9%, a difference of 0.13%), and Immigrants from Grenada (16.9%, a difference of 0.14%).
| Demographics | Rating | Rank | Single Father Poverty |
| Hispanics or Latinos | 6.1 /100 | #226 | Tragic 16.8% |
| British | 5.6 /100 | #227 | Tragic 16.8% |
| Belgians | 5.3 /100 | #228 | Tragic 16.8% |
| Israelis | 4.6 /100 | #229 | Tragic 16.8% |
| Immigrants | Trinidad and Tobago | 4.5 /100 | #230 | Tragic 16.8% |
| Spanish Americans | 3.7 /100 | #231 | Tragic 16.9% |
| Immigrants | Grenada | 3.7 /100 | #232 | Tragic 16.9% |
| Senegalese | 3.2 /100 | #233 | Tragic 16.9% |
| Marshallese | 3.1 /100 | #234 | Tragic 16.9% |
| Immigrants | Western Europe | 2.9 /100 | #235 | Tragic 16.9% |
| Immigrants | Germany | 2.9 /100 | #236 | Tragic 16.9% |
| Sub-Saharan Africans | 2.9 /100 | #237 | Tragic 16.9% |
| Immigrants | Saudi Arabia | 2.7 /100 | #238 | Tragic 16.9% |
| Bermudans | 2.6 /100 | #239 | Tragic 16.9% |
| Finns | 2.6 /100 | #240 | Tragic 16.9% |