Immigrants from Netherlands vs Senegalese Single Father Poverty
COMPARE
Immigrants from Netherlands
Senegalese
Single Father Poverty
Single Father Poverty Comparison
Immigrants from Netherlands
Senegalese
16.0%
SINGLE FATHER POVERTY
85.3/ 100
METRIC RATING
140th/ 347
METRIC RANK
16.9%
SINGLE FATHER POVERTY
3.2/ 100
METRIC RATING
233rd/ 347
METRIC RANK
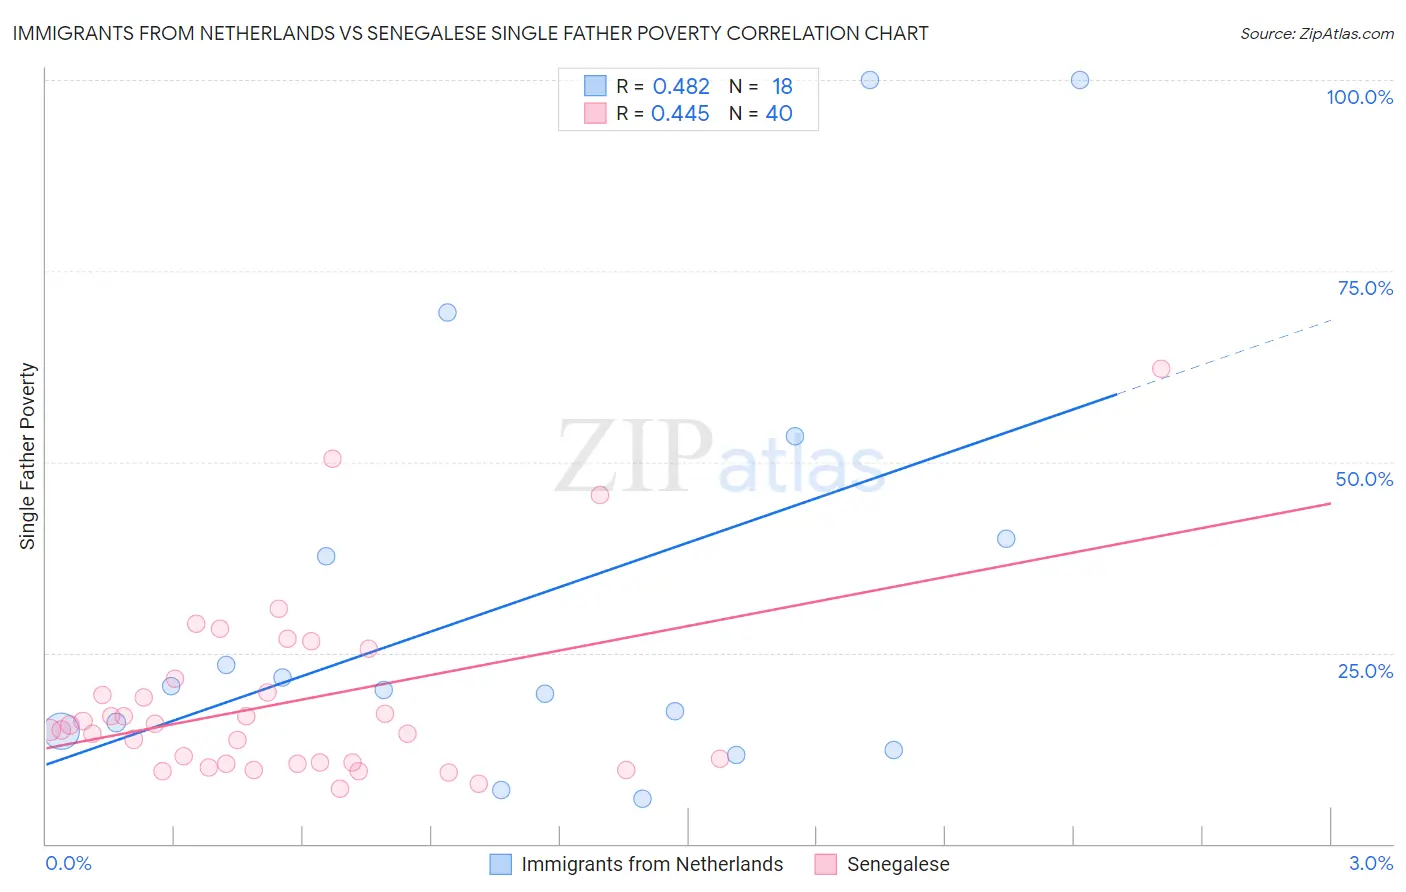
Immigrants from Netherlands vs Senegalese Single Father Poverty Correlation Chart
The statistical analysis conducted on geographies consisting of 195,225,242 people shows a moderate positive correlation between the proportion of Immigrants from Netherlands and poverty level among single fathers in the United States with a correlation coefficient (R) of 0.482 and weighted average of 16.0%. Similarly, the statistical analysis conducted on geographies consisting of 73,350,667 people shows a moderate positive correlation between the proportion of Senegalese and poverty level among single fathers in the United States with a correlation coefficient (R) of 0.445 and weighted average of 16.9%, a difference of 5.8%.
Single Father Poverty Correlation Summary
| Measurement | Immigrants from Netherlands | Senegalese |
| Minimum | 6.0% | 7.1% |
| Maximum | 100.0% | 62.2% |
| Range | 94.0% | 55.1% |
| Mean | 32.8% | 18.6% |
| Median | 20.4% | 15.2% |
| Interquartile 25% (IQ1) | 14.7% | 10.5% |
| Interquartile 75% (IQ3) | 40.0% | 20.7% |
| Interquartile Range (IQR) | 25.3% | 10.1% |
| Standard Deviation (Sample) | 29.4% | 11.8% |
| Standard Deviation (Population) | 28.6% | 11.7% |
Similar Demographics by Single Father Poverty
Demographics Similar to Immigrants from Netherlands by Single Father Poverty
In terms of single father poverty, the demographic groups most similar to Immigrants from Netherlands are South American (16.0%, a difference of 0.050%), Central American (16.0%, a difference of 0.17%), Liberian (16.0%, a difference of 0.17%), Immigrants from Mexico (16.0%, a difference of 0.17%), and Immigrants from the Azores (15.9%, a difference of 0.18%).
| Demographics | Rating | Rank | Single Father Poverty |
| Immigrants | Syria | 89.5 /100 | #133 | Excellent 15.9% |
| Immigrants | South America | 88.5 /100 | #134 | Excellent 15.9% |
| Immigrants | Sri Lanka | 88.2 /100 | #135 | Excellent 15.9% |
| Cypriots | 87.5 /100 | #136 | Excellent 15.9% |
| Immigrants | Azores | 87.2 /100 | #137 | Excellent 15.9% |
| Central Americans | 87.1 /100 | #138 | Excellent 16.0% |
| South Americans | 85.9 /100 | #139 | Excellent 16.0% |
| Immigrants | Netherlands | 85.3 /100 | #140 | Excellent 16.0% |
| Liberians | 83.3 /100 | #141 | Excellent 16.0% |
| Immigrants | Mexico | 83.3 /100 | #142 | Excellent 16.0% |
| Immigrants | Central America | 83.1 /100 | #143 | Excellent 16.0% |
| Immigrants | Kuwait | 81.4 /100 | #144 | Excellent 16.0% |
| Immigrants | Western Asia | 80.7 /100 | #145 | Excellent 16.0% |
| Immigrants | Hungary | 78.3 /100 | #146 | Good 16.1% |
| Colombians | 77.1 /100 | #147 | Good 16.1% |
Demographics Similar to Senegalese by Single Father Poverty
In terms of single father poverty, the demographic groups most similar to Senegalese are Marshallese (16.9%, a difference of 0.030%), Immigrants from Western Europe (16.9%, a difference of 0.12%), Immigrants from Germany (16.9%, a difference of 0.12%), Subsaharan African (16.9%, a difference of 0.13%), and Immigrants from Grenada (16.9%, a difference of 0.14%).
| Demographics | Rating | Rank | Single Father Poverty |
| Hispanics or Latinos | 6.1 /100 | #226 | Tragic 16.8% |
| British | 5.6 /100 | #227 | Tragic 16.8% |
| Belgians | 5.3 /100 | #228 | Tragic 16.8% |
| Israelis | 4.6 /100 | #229 | Tragic 16.8% |
| Immigrants | Trinidad and Tobago | 4.5 /100 | #230 | Tragic 16.8% |
| Spanish Americans | 3.7 /100 | #231 | Tragic 16.9% |
| Immigrants | Grenada | 3.7 /100 | #232 | Tragic 16.9% |
| Senegalese | 3.2 /100 | #233 | Tragic 16.9% |
| Marshallese | 3.1 /100 | #234 | Tragic 16.9% |
| Immigrants | Western Europe | 2.9 /100 | #235 | Tragic 16.9% |
| Immigrants | Germany | 2.9 /100 | #236 | Tragic 16.9% |
| Sub-Saharan Africans | 2.9 /100 | #237 | Tragic 16.9% |
| Immigrants | Saudi Arabia | 2.7 /100 | #238 | Tragic 16.9% |
| Bermudans | 2.6 /100 | #239 | Tragic 16.9% |
| Finns | 2.6 /100 | #240 | Tragic 16.9% |