Slovak vs Senegalese Unemployment Among Women with Children Under 18 years
COMPARE
Slovak
Senegalese
Unemployment Among Women with Children Under 18 years
Unemployment Among Women with Children Under 18 years Comparison
Slovaks
Senegalese
5.3%
UNEMPLOYMENT AMONG WOMEN WITH CHILDREN UNDER 18 YEARS
80.5/ 100
METRIC RATING
134th/ 347
METRIC RANK
6.2%
UNEMPLOYMENT AMONG WOMEN WITH CHILDREN UNDER 18 YEARS
0.0/ 100
METRIC RATING
274th/ 347
METRIC RANK
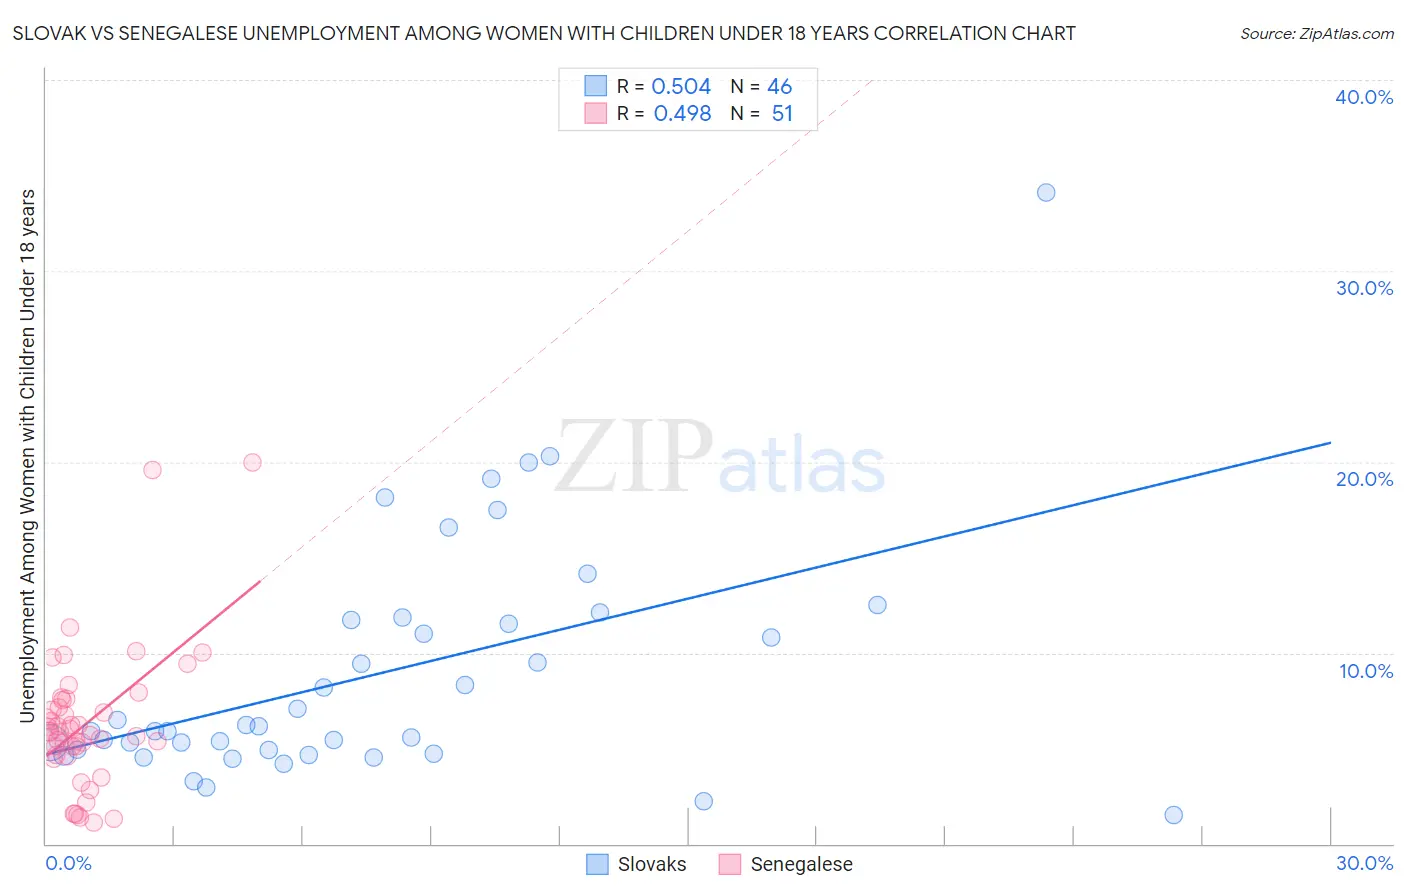
Slovak vs Senegalese Unemployment Among Women with Children Under 18 years Correlation Chart
The statistical analysis conducted on geographies consisting of 376,334,791 people shows a substantial positive correlation between the proportion of Slovaks and unemployment rate among women with children under the age of 18 in the United States with a correlation coefficient (R) of 0.504 and weighted average of 5.3%. Similarly, the statistical analysis conducted on geographies consisting of 77,660,225 people shows a moderate positive correlation between the proportion of Senegalese and unemployment rate among women with children under the age of 18 in the United States with a correlation coefficient (R) of 0.498 and weighted average of 6.2%, a difference of 17.0%.
Unemployment Among Women with Children Under 18 years Correlation Summary
| Measurement | Slovak | Senegalese |
| Minimum | 1.5% | 1.1% |
| Maximum | 34.1% | 20.0% |
| Range | 32.6% | 18.9% |
| Mean | 8.9% | 6.3% |
| Median | 6.0% | 5.9% |
| Interquartile 25% (IQ1) | 4.9% | 4.7% |
| Interquartile 75% (IQ3) | 11.7% | 7.5% |
| Interquartile Range (IQR) | 6.8% | 2.9% |
| Standard Deviation (Sample) | 6.3% | 3.7% |
| Standard Deviation (Population) | 6.2% | 3.6% |
Similar Demographics by Unemployment Among Women with Children Under 18 years
Demographics Similar to Slovaks by Unemployment Among Women with Children Under 18 years
In terms of unemployment among women with children under 18 years, the demographic groups most similar to Slovaks are Ethiopian (5.3%, a difference of 0.020%), New Zealander (5.3%, a difference of 0.070%), Immigrants from Ethiopia (5.3%, a difference of 0.11%), Immigrants from Jordan (5.3%, a difference of 0.12%), and Immigrants from Israel (5.3%, a difference of 0.17%).
| Demographics | Rating | Rank | Unemployment Among Women with Children Under 18 years |
| Whites/Caucasians | 82.9 /100 | #127 | Excellent 5.3% |
| Immigrants | South Africa | 82.8 /100 | #128 | Excellent 5.3% |
| Immigrants | Italy | 82.3 /100 | #129 | Excellent 5.3% |
| Immigrants | Austria | 82.1 /100 | #130 | Excellent 5.3% |
| Immigrants | Israel | 81.9 /100 | #131 | Excellent 5.3% |
| Immigrants | Ethiopia | 81.4 /100 | #132 | Excellent 5.3% |
| Ethiopians | 80.7 /100 | #133 | Excellent 5.3% |
| Slovaks | 80.5 /100 | #134 | Excellent 5.3% |
| New Zealanders | 79.9 /100 | #135 | Good 5.3% |
| Immigrants | Jordan | 79.5 /100 | #136 | Good 5.3% |
| Jordanians | 78.8 /100 | #137 | Good 5.3% |
| Argentineans | 78.8 /100 | #138 | Good 5.3% |
| Immigrants | Ukraine | 78.5 /100 | #139 | Good 5.3% |
| Immigrants | Norway | 76.2 /100 | #140 | Good 5.3% |
| Venezuelans | 76.0 /100 | #141 | Good 5.3% |
Demographics Similar to Senegalese by Unemployment Among Women with Children Under 18 years
In terms of unemployment among women with children under 18 years, the demographic groups most similar to Senegalese are Immigrants from Western Africa (6.2%, a difference of 0.020%), Salvadoran (6.2%, a difference of 0.10%), Dutch West Indian (6.2%, a difference of 0.18%), Immigrants from Ghana (6.2%, a difference of 0.28%), and Mexican American Indian (6.2%, a difference of 0.30%).
| Demographics | Rating | Rank | Unemployment Among Women with Children Under 18 years |
| French American Indians | 0.1 /100 | #267 | Tragic 6.2% |
| Trinidadians and Tobagonians | 0.1 /100 | #268 | Tragic 6.2% |
| Cajuns | 0.1 /100 | #269 | Tragic 6.2% |
| Ghanaians | 0.1 /100 | #270 | Tragic 6.2% |
| Central Americans | 0.0 /100 | #271 | Tragic 6.2% |
| Salvadorans | 0.0 /100 | #272 | Tragic 6.2% |
| Immigrants | Western Africa | 0.0 /100 | #273 | Tragic 6.2% |
| Senegalese | 0.0 /100 | #274 | Tragic 6.2% |
| Dutch West Indians | 0.0 /100 | #275 | Tragic 6.2% |
| Immigrants | Ghana | 0.0 /100 | #276 | Tragic 6.2% |
| Mexican American Indians | 0.0 /100 | #277 | Tragic 6.2% |
| Immigrants | Barbados | 0.0 /100 | #278 | Tragic 6.2% |
| Immigrants | Portugal | 0.0 /100 | #279 | Tragic 6.3% |
| Guatemalans | 0.0 /100 | #280 | Tragic 6.3% |
| Immigrants | El Salvador | 0.0 /100 | #281 | Tragic 6.3% |