Ottawa vs Jamaican Single Male Poverty

COMPARE

Ottawa
Race
Ancestry
AfghanAfricanAlaska NativeAlaskan AthabascanAlbanianAleutAlsatianAmericanApacheArabArapahoArgentineanArmenianAssyrian/Chaldean/SyriacAustralianAustrianBahamianBangladeshiBarbadianBasqueBelgianBelizeanBermudanBhutaneseBlackfeetBolivianBrazilianBritishBritish West IndianBulgarianBurmeseCajunCambodianCanadianCape VerdeanCarpatho RusynCelticCentral AmericanCentral American IndianCherokeeCheyenneChickasawChileanChineseChippewaChoctawColombianColvilleComancheCosta RicanCreeCreekCroatianCrowCubanCypriotCzechCzechoslovakianDanishDelawareDominicanDutchDutch West IndianEastern EuropeanEcuadorianEgyptianEnglishEstonianEthiopianEuropeanFijianFilipinoFinnishFrenchFrench American IndianFrench CanadianGermanGerman RussianGhanaianGreekGuamanian/ChamorroGuatemalanGuyaneseHaitianHmongHonduranHopiHoumaHungarianIcelanderIndian (Asian)IndonesianInupiatIranianIraqiIrishIroquoisIsraeliItalianJapaneseJordanianKenyanKiowaKoreanLaotianLatvianLebaneseLiberianLithuanianLumbeeLuxembourgerMacedonianMalaysianMalteseMarshalleseMenomineeMexicanMexican American IndianMongolianMoroccanNative HawaiianNavajoNepaleseNew ZealanderNicaraguanNigerianNorthern EuropeanNorwegianOkinawanOsageOttawaPaiutePakistaniPalestinianPanamanianParaguayanPennsylvania GermanPeruvianPimaPolishPortuguesePotawatomiPuebloPuerto RicanPuget Sound SalishRomanianRussianSalvadoranSamoanScandinavianScotch-IrishScottishSeminoleSenegaleseSerbianShoshoneSierra LeoneanSiouxSlavicSlovakSloveneSomaliSouth AfricanSouth AmericanSouth American IndianSoviet UnionSpaniardSpanishSpanish AmericanSpanish American IndianSri LankanSubsaharan AfricanSudaneseSwedishSwissSyrianTaiwaneseThaiTlingit-HaidaTohono O'OdhamTonganTrinidadian and TobagonianTsimshianTurkishU.S. Virgin IslanderUgandanUkrainianUruguayanUteVenezuelanVietnameseWelshWest IndianYakamaYaquiYugoslavianYumanYup'ikZimbabwean
Immigration
NonimmigrantsImmigrantsAfghanistanAfricaAlbaniaArgentinaArmeniaAsiaAustraliaAustriaBahamasBangladeshBarbadosBelarusBelgiumBelizeBoliviaBosnia and HerzegovinaBrazilBulgariaBurma/MyanmarCabo VerdeCambodiaCameroonCanadaCaribbeanCentral AmericaChileChinaColombiaCongoCosta RicaCroatiaCubaCzechoslovakiaDenmarkDominicaDominican RepublicEastern AfricaEastern AsiaEastern EuropeEcuadorEgyptEl SalvadorEnglandEritreaEthiopiaEuropeFijiFranceGermanyGhanaGreeceGrenadaGuatemalaGuyanaHaitiHondurasHong KongHungaryIndiaIndonesiaIranIraqIrelandIsraelItalyJamaicaJapanJordanKazakhstanKenyaKoreaKuwaitLaosLatin AmericaLatviaLebanonLiberiaLithuaniaMalaysiaMexicoMicronesiaMiddle AfricaMoldovaMoroccoNepalNetherlandsNicaraguaNigeriaNorth AmericaNorth MacedoniaNorthern AfricaNorthern EuropeNorwayOceaniaPakistanPanamaPeruPhilippinesPolandPortugalRomaniaRussiaSaudi ArabiaScotlandSenegalSerbiaSierra LeoneSingaporeSomaliaSouth AfricaSouth AmericaSouth Central AsiaSouth Eastern AsiaSouthern EuropeSpainSri LankaSt. Vincent and the GrenadinesSudanSwedenSwitzerlandSyriaTaiwanThailandTrinidad and TobagoTurkeyUgandaUkraineUruguayUzbekistanVenezuelaVietnamWest IndiesWestern AfricaWestern AsiaWestern EuropeYemenZaireZimbabweAzores
Jamaican
Race
Ancestry
AfghanAfricanAlaska NativeAlaskan AthabascanAlbanianAleutAlsatianAmericanApacheArabArapahoArgentineanArmenianAssyrian/Chaldean/SyriacAustralianAustrianBahamianBangladeshiBarbadianBasqueBelgianBelizeanBermudanBhutaneseBlackfeetBolivianBrazilianBritishBritish West IndianBulgarianBurmeseCajunCambodianCanadianCape VerdeanCarpatho RusynCelticCentral AmericanCentral American IndianCherokeeCheyenneChickasawChileanChineseChippewaChoctawColombianColvilleComancheCosta RicanCreeCreekCroatianCrowCubanCypriotCzechCzechoslovakianDanishDelawareDominicanDutchDutch West IndianEastern EuropeanEcuadorianEgyptianEnglishEstonianEthiopianEuropeanFijianFilipinoFinnishFrenchFrench American IndianFrench CanadianGermanGerman RussianGhanaianGreekGuamanian/ChamorroGuatemalanGuyaneseHaitianHmongHonduranHopiHoumaHungarianIcelanderIndian (Asian)IndonesianInupiatIranianIraqiIrishIroquoisIsraeliItalianJamaicanJapaneseJordanianKenyanKiowaKoreanLaotianLatvianLebaneseLiberianLithuanianLumbeeLuxembourgerMacedonianMalaysianMalteseMarshalleseMenomineeMexicanMexican American IndianMongolianMoroccanNative HawaiianNavajoNepaleseNew ZealanderNicaraguanNigerianNorthern EuropeanNorwegianOkinawanOsagePaiutePakistaniPalestinianPanamanianParaguayanPennsylvania GermanPeruvianPimaPolishPortuguesePotawatomiPuebloPuerto RicanPuget Sound SalishRomanianRussianSalvadoranSamoanScandinavianScotch-IrishScottishSeminoleSenegaleseSerbianShoshoneSierra LeoneanSiouxSlavicSlovakSloveneSomaliSouth AfricanSouth AmericanSouth American IndianSoviet UnionSpaniardSpanishSpanish AmericanSpanish American IndianSri LankanSubsaharan AfricanSudaneseSwedishSwissSyrianTaiwaneseThaiTlingit-HaidaTohono O'OdhamTonganTrinidadian and TobagonianTsimshianTurkishU.S. Virgin IslanderUgandanUkrainianUruguayanUteVenezuelanVietnameseWelshWest IndianYakamaYaquiYugoslavianYumanYup'ikZimbabwean
Immigration
NonimmigrantsImmigrantsAfghanistanAfricaAlbaniaArgentinaArmeniaAsiaAustraliaAustriaBahamasBangladeshBarbadosBelarusBelgiumBelizeBoliviaBosnia and HerzegovinaBrazilBulgariaBurma/MyanmarCabo VerdeCambodiaCameroonCanadaCaribbeanCentral AmericaChileChinaColombiaCongoCosta RicaCroatiaCubaCzechoslovakiaDenmarkDominicaDominican RepublicEastern AfricaEastern AsiaEastern EuropeEcuadorEgyptEl SalvadorEnglandEritreaEthiopiaEuropeFijiFranceGermanyGhanaGreeceGrenadaGuatemalaGuyanaHaitiHondurasHong KongHungaryIndiaIndonesiaIranIraqIrelandIsraelItalyJamaicaJapanJordanKazakhstanKenyaKoreaKuwaitLaosLatin AmericaLatviaLebanonLiberiaLithuaniaMalaysiaMexicoMicronesiaMiddle AfricaMoldovaMoroccoNepalNetherlandsNicaraguaNigeriaNorth AmericaNorth MacedoniaNorthern AfricaNorthern EuropeNorwayOceaniaPakistanPanamaPeruPhilippinesPolandPortugalRomaniaRussiaSaudi ArabiaScotlandSenegalSerbiaSierra LeoneSingaporeSomaliaSouth AfricaSouth AmericaSouth Central AsiaSouth Eastern AsiaSouthern EuropeSpainSri LankaSt. Vincent and the GrenadinesSudanSwedenSwitzerlandSyriaTaiwanThailandTrinidad and TobagoTurkeyUgandaUkraineUruguayUzbekistanVenezuelaVietnamWest IndiesWestern AfricaWestern AsiaWestern EuropeYemenZaireZimbabweAzores
Single Male Poverty
Income
Poverty
Unemployment
Labor Participation
Family Structure
Vehicle Availability
Education Level
Disability

Single Male Poverty Comparison

Ottawa

Jamaicans

Tragic
Tragic
14.6%
SINGLE MALE POVERTY
0.0/ 100
METRIC RATING
294th/ 347
METRIC RANK
13.2%
SINGLE MALE POVERTY
7.7/ 100
METRIC RATING
226th/ 347
METRIC RANK

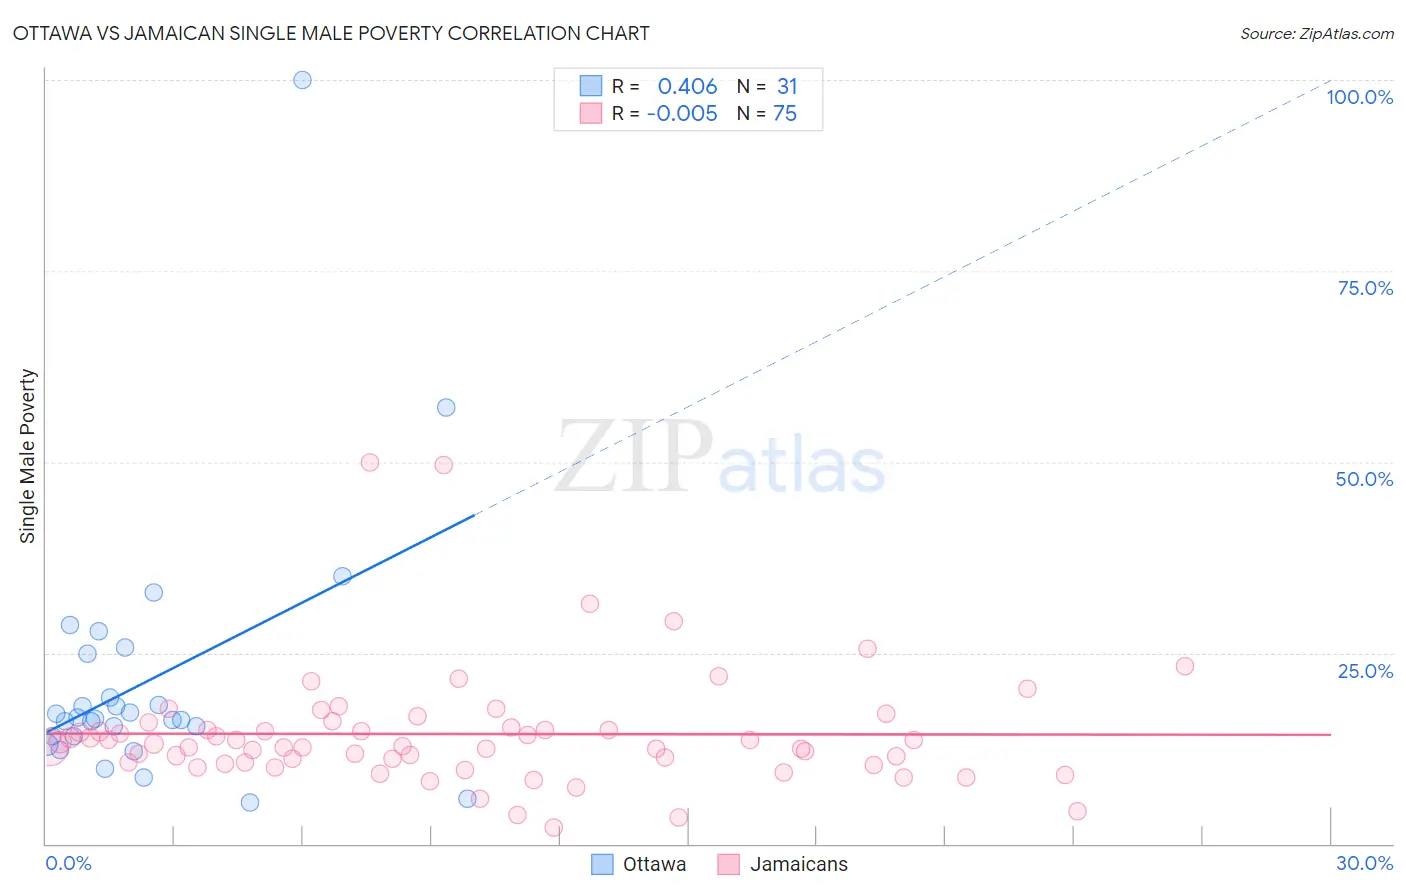
Ottawa vs Jamaican Single Male Poverty Correlation Chart

The statistical analysis conducted on geographies consisting of 47,840,673 people shows a moderate positive correlation between the proportion of Ottawa and poverty level among single males in the United States with a correlation coefficient (R) of 0.406 and weighted average of 14.6%. Similarly, the statistical analysis conducted on geographies consisting of 330,158,708 people shows no correlation between the proportion of Jamaicans and poverty level among single males in the United States with a correlation coefficient (R) of -0.005 and weighted average of 13.2%, a difference of 10.6%.
Ottawa vs Jamaican Single Male Poverty

Single Male Poverty Correlation Summary

MeasurementOttawaJamaican
Minimum5.4%2.1%
Maximum100.0%50.0%
Range94.6%47.9%
Mean21.4%14.4%
Median16.3%12.7%
Interquartile 25% (IQ1)14.0%10.6%
Interquartile 75% (IQ3)24.9%15.2%
Interquartile Range (IQR)10.9%4.5%
Standard Deviation (Sample)17.7%7.8%
Standard Deviation (Population)17.4%7.8%

Similar Demographics by Single Male Poverty

Demographics Similar to Ottawa by Single Male Poverty

In terms of single male poverty, the demographic groups most similar to Ottawa are French Canadian (14.6%, a difference of 0.19%), Nonimmigrants (14.6%, a difference of 0.30%), Bahamian (14.6%, a difference of 0.43%), Scotch-Irish (14.7%, a difference of 0.44%), and U.S. Virgin Islander (14.5%, a difference of 0.59%).
DemographicsRating | RankSingle Male Poverty
Iroquois
0.0
/100
|
#287
Tragic
14.5%
Whites/Caucasians
0.0
/100
|
#288
Tragic
14.5%
Immigrants | Dominica
0.0
/100
|
#289
Tragic
14.5%
U.S. Virgin Islanders
0.0
/100
|
#290
Tragic
14.5%
Bahamians
0.0
/100
|
#291
Tragic
14.6%
Immigrants | Nonimmigrants
0.0
/100
|
#292
Tragic
14.6%
French Canadians
0.0
/100
|
#293
Tragic
14.6%
Ottawa
0.0
/100
|
#294
Tragic
14.6%
Scotch-Irish
0.0
/100
|
#295
Tragic
14.7%
Africans
0.0
/100
|
#296
Tragic
14.7%
Immigrants | Dominican Republic
0.0
/100
|
#297
Tragic
14.8%
French American Indians
0.0
/100
|
#298
Tragic
15.0%
Delaware
0.0
/100
|
#299
Tragic
15.0%
Cree
0.0
/100
|
#300
Tragic
15.1%
Dominicans
0.0
/100
|
#301
Tragic
15.2%

Demographics Similar to Jamaicans by Single Male Poverty

In terms of single male poverty, the demographic groups most similar to Jamaicans are Haitian (13.2%, a difference of 0.13%), Immigrants from Denmark (13.2%, a difference of 0.16%), Lebanese (13.2%, a difference of 0.21%), Somali (13.2%, a difference of 0.22%), and Immigrants from the Azores (13.2%, a difference of 0.25%).
DemographicsRating | RankSingle Male Poverty
Immigrants | Burma/Myanmar
12.6
/100
|
#219
Poor
13.1%
Central Americans
10.9
/100
|
#220
Poor
13.2%
New Zealanders
10.7
/100
|
#221
Poor
13.2%
Immigrants | Western Europe
10.0
/100
|
#222
Poor
13.2%
Immigrants | Azores
9.3
/100
|
#223
Tragic
13.2%
Somalis
9.1
/100
|
#224
Tragic
13.2%
Immigrants | Denmark
8.7
/100
|
#225
Tragic
13.2%
Jamaicans
7.7
/100
|
#226
Tragic
13.2%
Haitians
7.0
/100
|
#227
Tragic
13.2%
Lebanese
6.6
/100
|
#228
Tragic
13.2%
Europeans
6.2
/100
|
#229
Tragic
13.3%
Ghanaians
6.1
/100
|
#230
Tragic
13.3%
Slavs
5.3
/100
|
#231
Tragic
13.3%
Immigrants | Caribbean
5.0
/100
|
#232
Tragic
13.3%
British
4.0
/100
|
#233
Tragic
13.3%