Slovak vs Cajun Median Family Income
COMPARE
Slovak
Cajun
Median Family Income
Median Family Income Comparison
Slovaks
Cajuns
$103,729
MEDIAN FAMILY INCOME
63.1/ 100
METRIC RATING
165th/ 347
METRIC RANK
$87,157
MEDIAN FAMILY INCOME
0.0/ 100
METRIC RATING
297th/ 347
METRIC RANK
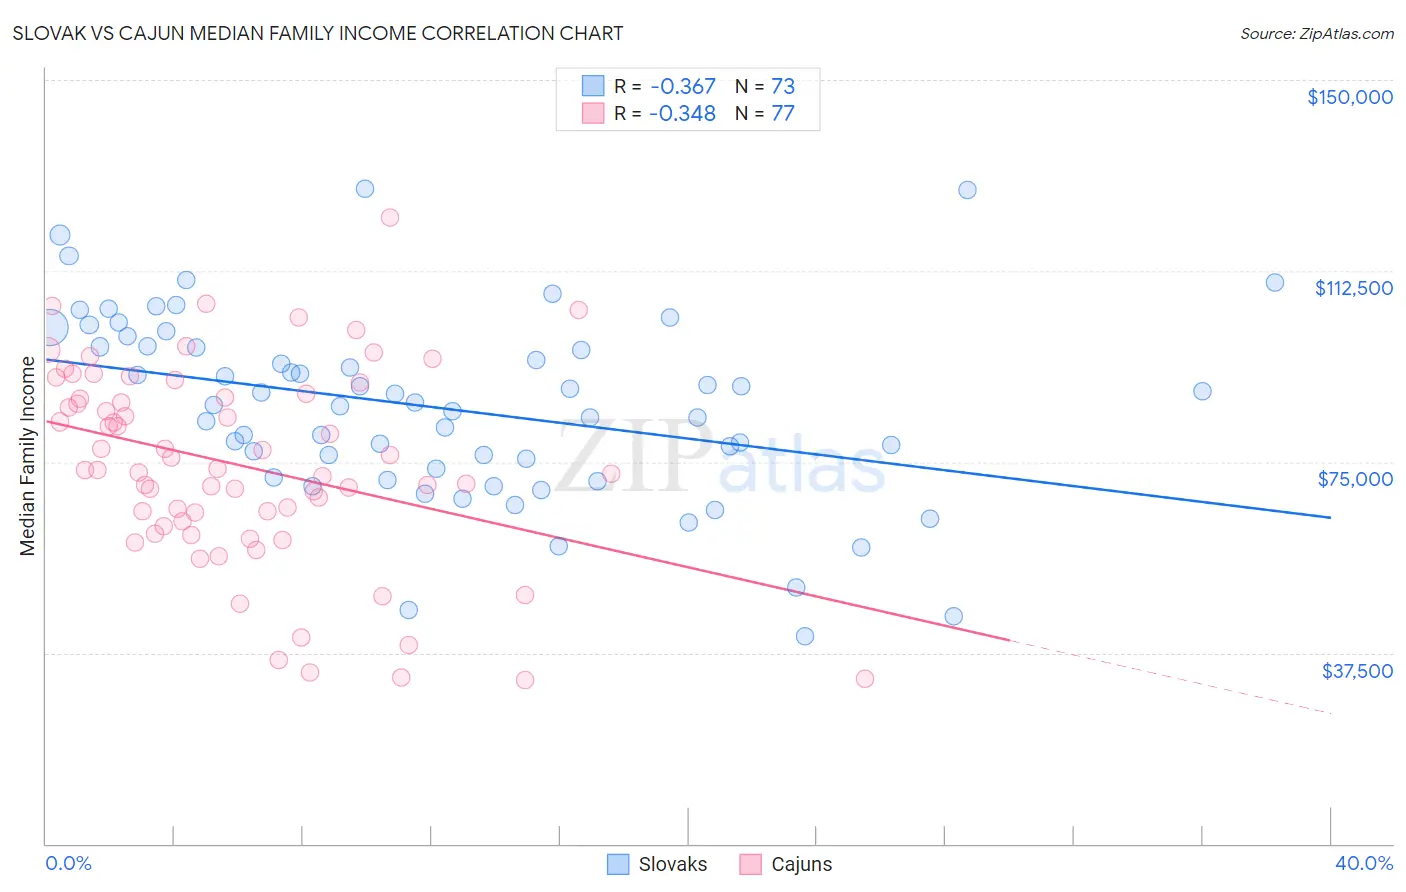
Slovak vs Cajun Median Family Income Correlation Chart
The statistical analysis conducted on geographies consisting of 397,537,551 people shows a mild negative correlation between the proportion of Slovaks and median family income in the United States with a correlation coefficient (R) of -0.367 and weighted average of $103,729. Similarly, the statistical analysis conducted on geographies consisting of 149,670,371 people shows a mild negative correlation between the proportion of Cajuns and median family income in the United States with a correlation coefficient (R) of -0.348 and weighted average of $87,157, a difference of 19.0%.
Median Family Income Correlation Summary
| Measurement | Slovak | Cajun |
| Minimum | $40,809 | $32,222 |
| Maximum | $128,732 | $122,896 |
| Range | $87,923 | $90,674 |
| Mean | $85,532 | $74,286 |
| Median | $86,184 | $73,392 |
| Interquartile 25% (IQ1) | $72,785 | $62,875 |
| Interquartile 75% (IQ3) | $97,619 | $88,056 |
| Interquartile Range (IQR) | $24,833 | $25,181 |
| Standard Deviation (Sample) | $18,291 | $19,414 |
| Standard Deviation (Population) | $18,165 | $19,288 |
Similar Demographics by Median Family Income
Demographics Similar to Slovaks by Median Family Income
In terms of median family income, the demographic groups most similar to Slovaks are English ($103,684, a difference of 0.040%), South American Indian ($103,624, a difference of 0.10%), Sierra Leonean ($103,859, a difference of 0.13%), Immigrants from Peru ($103,534, a difference of 0.19%), and Immigrants from Sierra Leone ($103,990, a difference of 0.25%).
| Demographics | Rating | Rank | Median Family Income |
| Scandinavians | 70.8 /100 | #158 | Good $104,410 |
| Swiss | 70.7 /100 | #159 | Good $104,396 |
| Scottish | 69.5 /100 | #160 | Good $104,288 |
| Icelanders | 69.4 /100 | #161 | Good $104,282 |
| Immigrants | Sierra Leone | 66.2 /100 | #162 | Good $103,990 |
| Costa Ricans | 66.2 /100 | #163 | Good $103,989 |
| Sierra Leoneans | 64.7 /100 | #164 | Good $103,859 |
| Slovaks | 63.1 /100 | #165 | Good $103,729 |
| English | 62.6 /100 | #166 | Good $103,684 |
| South American Indians | 61.9 /100 | #167 | Good $103,624 |
| Immigrants | Peru | 60.8 /100 | #168 | Good $103,534 |
| Czechoslovakians | 57.6 /100 | #169 | Average $103,273 |
| Immigrants | Uzbekistan | 56.6 /100 | #170 | Average $103,197 |
| Alsatians | 54.3 /100 | #171 | Average $103,010 |
| Immigrants | Eritrea | 51.9 /100 | #172 | Average $102,823 |
Demographics Similar to Cajuns by Median Family Income
In terms of median family income, the demographic groups most similar to Cajuns are Immigrants from Guatemala ($87,191, a difference of 0.040%), Yaqui ($87,289, a difference of 0.15%), Immigrants from Latin America ($86,989, a difference of 0.19%), Fijian ($87,387, a difference of 0.26%), and Chippewa ($86,852, a difference of 0.35%).
| Demographics | Rating | Rank | Median Family Income |
| Shoshone | 0.1 /100 | #290 | Tragic $87,872 |
| Immigrants | Cabo Verde | 0.1 /100 | #291 | Tragic $87,830 |
| Africans | 0.1 /100 | #292 | Tragic $87,820 |
| Ute | 0.0 /100 | #293 | Tragic $87,596 |
| Fijians | 0.0 /100 | #294 | Tragic $87,387 |
| Yaqui | 0.0 /100 | #295 | Tragic $87,289 |
| Immigrants | Guatemala | 0.0 /100 | #296 | Tragic $87,191 |
| Cajuns | 0.0 /100 | #297 | Tragic $87,157 |
| Immigrants | Latin America | 0.0 /100 | #298 | Tragic $86,989 |
| Chippewa | 0.0 /100 | #299 | Tragic $86,852 |
| Ottawa | 0.0 /100 | #300 | Tragic $86,380 |
| Colville | 0.0 /100 | #301 | Tragic $85,792 |
| Spanish American Indians | 0.0 /100 | #302 | Tragic $85,728 |
| Hispanics or Latinos | 0.0 /100 | #303 | Tragic $85,647 |
| Mexicans | 0.0 /100 | #304 | Tragic $85,618 |