Nonimmigrants vs Cajun Poverty
COMPARE
Nonimmigrants
Cajun
Poverty
Poverty Comparison
Nonimmigrants
Cajuns
13.3%
POVERTY
3.3/ 100
METRIC RATING
216th/ 347
METRIC RANK
15.7%
POVERTY
0.0/ 100
METRIC RATING
312th/ 347
METRIC RANK
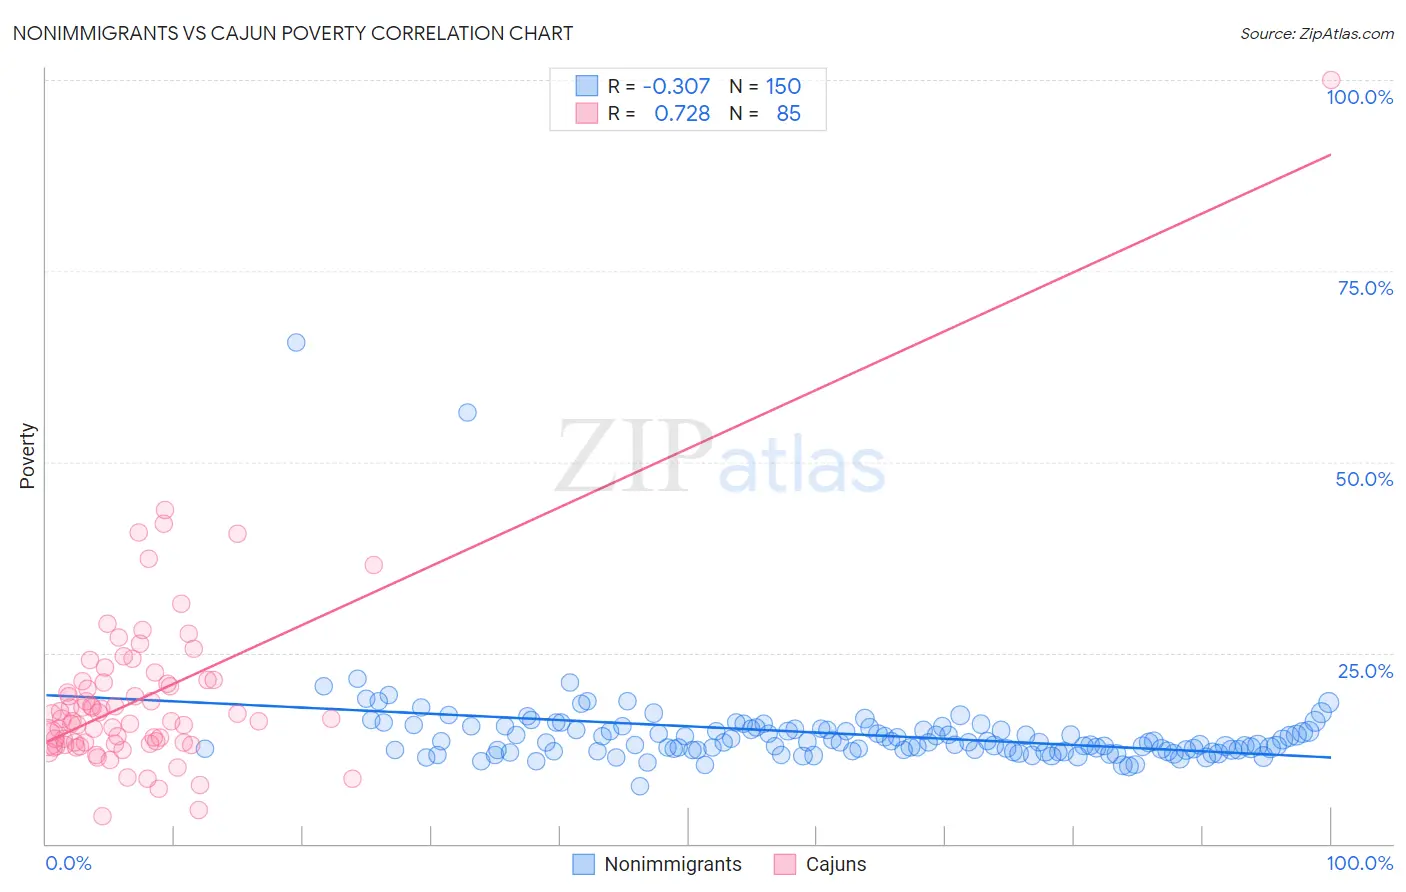
Nonimmigrants vs Cajun Poverty Correlation Chart
The statistical analysis conducted on geographies consisting of 583,909,037 people shows a mild negative correlation between the proportion of Nonimmigrants and poverty level in the United States with a correlation coefficient (R) of -0.307 and weighted average of 13.3%. Similarly, the statistical analysis conducted on geographies consisting of 149,691,994 people shows a strong positive correlation between the proportion of Cajuns and poverty level in the United States with a correlation coefficient (R) of 0.728 and weighted average of 15.7%, a difference of 17.9%.
Poverty Correlation Summary
| Measurement | Nonimmigrants | Cajun |
| Minimum | 7.5% | 3.7% |
| Maximum | 65.6% | 100.0% |
| Range | 58.1% | 96.3% |
| Mean | 14.4% | 19.2% |
| Median | 13.3% | 16.3% |
| Interquartile 25% (IQ1) | 12.2% | 13.1% |
| Interquartile 75% (IQ3) | 15.0% | 21.3% |
| Interquartile Range (IQR) | 2.7% | 8.2% |
| Standard Deviation (Sample) | 5.9% | 12.0% |
| Standard Deviation (Population) | 5.9% | 11.9% |
Similar Demographics by Poverty
Demographics Similar to Nonimmigrants by Poverty
In terms of poverty, the demographic groups most similar to Nonimmigrants are Japanese (13.3%, a difference of 0.0%), Immigrants from Uzbekistan (13.3%, a difference of 0.040%), Immigrants from Thailand (13.3%, a difference of 0.10%), Immigrants from Cambodia (13.4%, a difference of 0.23%), and Bermudan (13.3%, a difference of 0.26%).
| Demographics | Rating | Rank | Poverty |
| Malaysians | 6.1 /100 | #209 | Tragic 13.1% |
| Immigrants | Azores | 6.1 /100 | #210 | Tragic 13.1% |
| Moroccans | 5.2 /100 | #211 | Tragic 13.2% |
| Immigrants | Immigrants | 4.3 /100 | #212 | Tragic 13.2% |
| Immigrants | Panama | 4.1 /100 | #213 | Tragic 13.3% |
| Bermudans | 3.7 /100 | #214 | Tragic 13.3% |
| Japanese | 3.3 /100 | #215 | Tragic 13.3% |
| Immigrants | Nonimmigrants | 3.3 /100 | #216 | Tragic 13.3% |
| Immigrants | Uzbekistan | 3.2 /100 | #217 | Tragic 13.3% |
| Immigrants | Thailand | 3.1 /100 | #218 | Tragic 13.3% |
| Immigrants | Cambodia | 3.0 /100 | #219 | Tragic 13.4% |
| Americans | 2.9 /100 | #220 | Tragic 13.4% |
| Alsatians | 2.6 /100 | #221 | Tragic 13.4% |
| Immigrants | Micronesia | 2.6 /100 | #222 | Tragic 13.4% |
| Immigrants | Africa | 2.5 /100 | #223 | Tragic 13.4% |
Demographics Similar to Cajuns by Poverty
In terms of poverty, the demographic groups most similar to Cajuns are Chippewa (15.7%, a difference of 0.16%), Immigrants from Grenada (15.8%, a difference of 0.44%), Dutch West Indian (15.6%, a difference of 0.54%), Immigrants from Somalia (15.8%, a difference of 0.56%), and Seminole (15.6%, a difference of 0.63%).
| Demographics | Rating | Rank | Poverty |
| Immigrants | Guatemala | 0.0 /100 | #305 | Tragic 15.5% |
| Creek | 0.0 /100 | #306 | Tragic 15.6% |
| Africans | 0.0 /100 | #307 | Tragic 15.6% |
| Choctaw | 0.0 /100 | #308 | Tragic 15.6% |
| Seminole | 0.0 /100 | #309 | Tragic 15.6% |
| Dutch West Indians | 0.0 /100 | #310 | Tragic 15.6% |
| Chippewa | 0.0 /100 | #311 | Tragic 15.7% |
| Cajuns | 0.0 /100 | #312 | Tragic 15.7% |
| Immigrants | Grenada | 0.0 /100 | #313 | Tragic 15.8% |
| Immigrants | Somalia | 0.0 /100 | #314 | Tragic 15.8% |
| British West Indians | 0.0 /100 | #315 | Tragic 15.9% |
| Hondurans | 0.0 /100 | #316 | Tragic 15.9% |
| U.S. Virgin Islanders | 0.0 /100 | #317 | Tragic 16.1% |
| Immigrants | Dominica | 0.0 /100 | #318 | Tragic 16.1% |
| Immigrants | Congo | 0.0 /100 | #319 | Tragic 16.1% |