Immigrants from Portugal vs U.S. Virgin Islander Poverty
COMPARE
Immigrants from Portugal
U.S. Virgin Islander
Poverty
Poverty Comparison
Immigrants from Portugal
U.S. Virgin Islanders
12.3%
POVERTY
50.5/ 100
METRIC RATING
172nd/ 347
METRIC RANK
16.1%
POVERTY
0.0/ 100
METRIC RATING
317th/ 347
METRIC RANK
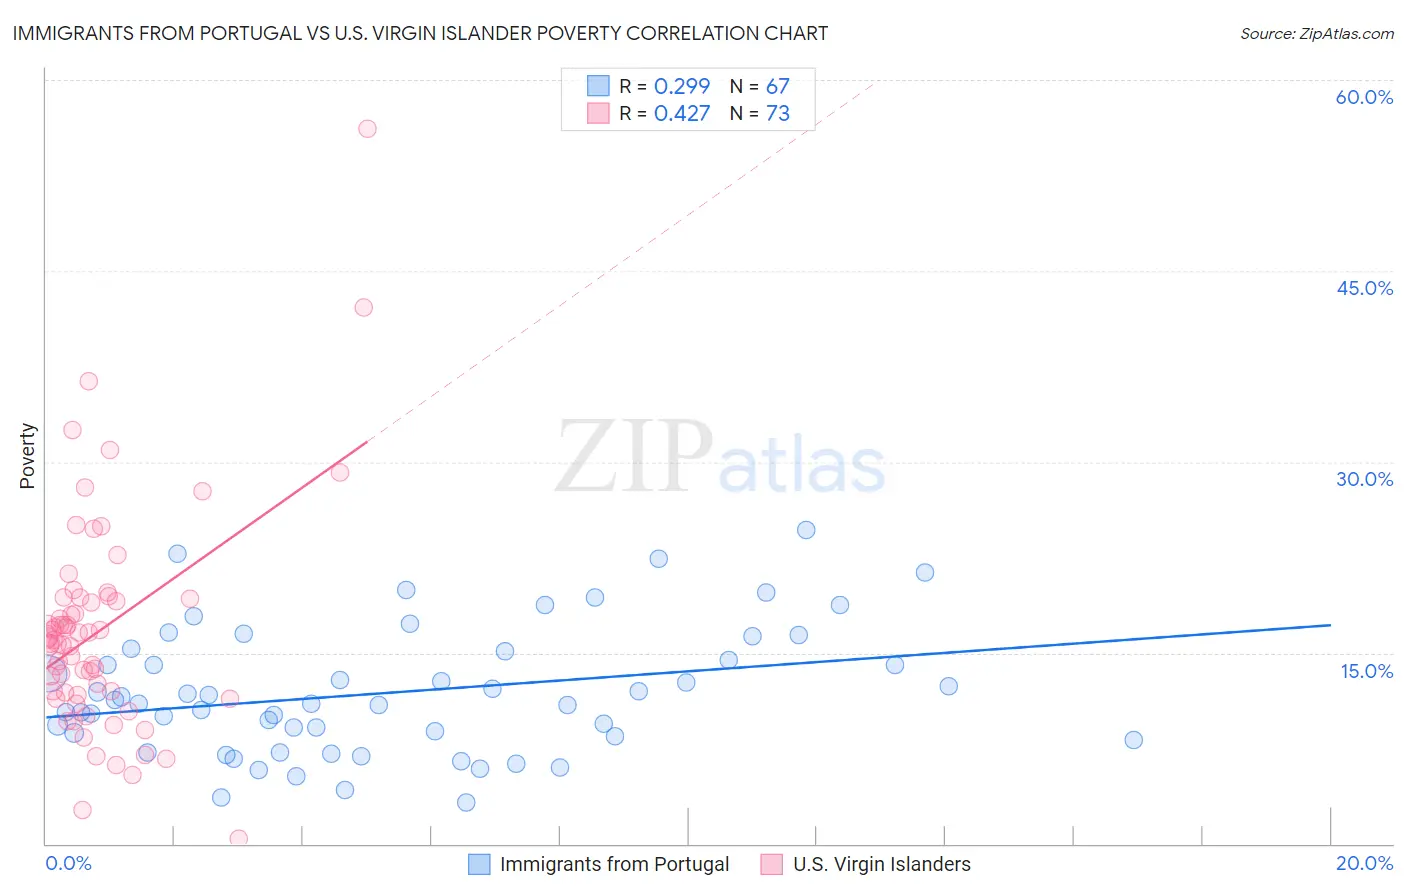
Immigrants from Portugal vs U.S. Virgin Islander Poverty Correlation Chart
The statistical analysis conducted on geographies consisting of 174,738,655 people shows a weak positive correlation between the proportion of Immigrants from Portugal and poverty level in the United States with a correlation coefficient (R) of 0.299 and weighted average of 12.3%. Similarly, the statistical analysis conducted on geographies consisting of 87,513,467 people shows a moderate positive correlation between the proportion of U.S. Virgin Islanders and poverty level in the United States with a correlation coefficient (R) of 0.427 and weighted average of 16.1%, a difference of 30.4%.
Poverty Correlation Summary
| Measurement | Immigrants from Portugal | U.S. Virgin Islander |
| Minimum | 3.3% | 0.43% |
| Maximum | 24.6% | 56.2% |
| Range | 21.3% | 55.8% |
| Mean | 11.9% | 16.8% |
| Median | 11.0% | 16.0% |
| Interquartile 25% (IQ1) | 8.5% | 11.8% |
| Interquartile 75% (IQ3) | 15.1% | 19.3% |
| Interquartile Range (IQR) | 6.6% | 7.5% |
| Standard Deviation (Sample) | 4.9% | 8.7% |
| Standard Deviation (Population) | 4.9% | 8.6% |
Similar Demographics by Poverty
Demographics Similar to Immigrants from Portugal by Poverty
In terms of poverty, the demographic groups most similar to Immigrants from Portugal are Celtic (12.3%, a difference of 0.040%), Lebanese (12.3%, a difference of 0.050%), Immigrants from Spain (12.3%, a difference of 0.070%), South American (12.3%, a difference of 0.18%), and Immigrants from Colombia (12.3%, a difference of 0.28%).
| Demographics | Rating | Rank | Poverty |
| Immigrants | Albania | 57.7 /100 | #165 | Average 12.2% |
| Venezuelans | 56.9 /100 | #166 | Average 12.2% |
| Immigrants | Chile | 56.7 /100 | #167 | Average 12.2% |
| Immigrants | Venezuela | 56.5 /100 | #168 | Average 12.2% |
| Whites/Caucasians | 55.4 /100 | #169 | Average 12.3% |
| Immigrants | Oceania | 54.6 /100 | #170 | Average 12.3% |
| Immigrants | Spain | 51.3 /100 | #171 | Average 12.3% |
| Immigrants | Portugal | 50.5 /100 | #172 | Average 12.3% |
| Celtics | 50.1 /100 | #173 | Average 12.3% |
| Lebanese | 50.0 /100 | #174 | Average 12.3% |
| South Americans | 48.7 /100 | #175 | Average 12.3% |
| Immigrants | Colombia | 47.7 /100 | #176 | Average 12.3% |
| Immigrants | Syria | 47.5 /100 | #177 | Average 12.3% |
| Uruguayans | 44.7 /100 | #178 | Average 12.4% |
| Immigrants | Morocco | 44.0 /100 | #179 | Average 12.4% |
Demographics Similar to U.S. Virgin Islanders by Poverty
In terms of poverty, the demographic groups most similar to U.S. Virgin Islanders are Immigrants from Dominica (16.1%, a difference of 0.29%), Immigrants from Congo (16.1%, a difference of 0.49%), Immigrants from Honduras (16.2%, a difference of 0.72%), British West Indian (15.9%, a difference of 1.3%), and Honduran (15.9%, a difference of 1.3%).
| Demographics | Rating | Rank | Poverty |
| Dutch West Indians | 0.0 /100 | #310 | Tragic 15.6% |
| Chippewa | 0.0 /100 | #311 | Tragic 15.7% |
| Cajuns | 0.0 /100 | #312 | Tragic 15.7% |
| Immigrants | Grenada | 0.0 /100 | #313 | Tragic 15.8% |
| Immigrants | Somalia | 0.0 /100 | #314 | Tragic 15.8% |
| British West Indians | 0.0 /100 | #315 | Tragic 15.9% |
| Hondurans | 0.0 /100 | #316 | Tragic 15.9% |
| U.S. Virgin Islanders | 0.0 /100 | #317 | Tragic 16.1% |
| Immigrants | Dominica | 0.0 /100 | #318 | Tragic 16.1% |
| Immigrants | Congo | 0.0 /100 | #319 | Tragic 16.1% |
| Immigrants | Honduras | 0.0 /100 | #320 | Tragic 16.2% |
| Arapaho | 0.0 /100 | #321 | Tragic 16.3% |
| Menominee | 0.0 /100 | #322 | Tragic 16.4% |
| Colville | 0.0 /100 | #323 | Tragic 16.6% |
| Yakama | 0.0 /100 | #324 | Tragic 16.7% |