Serbian vs Belgian Single Father Poverty
COMPARE
Serbian
Belgian
Single Father Poverty
Single Father Poverty Comparison
Serbians
Belgians
16.4%
SINGLE FATHER POVERTY
40.9/ 100
METRIC RATING
179th/ 347
METRIC RANK
16.8%
SINGLE FATHER POVERTY
5.3/ 100
METRIC RATING
228th/ 347
METRIC RANK
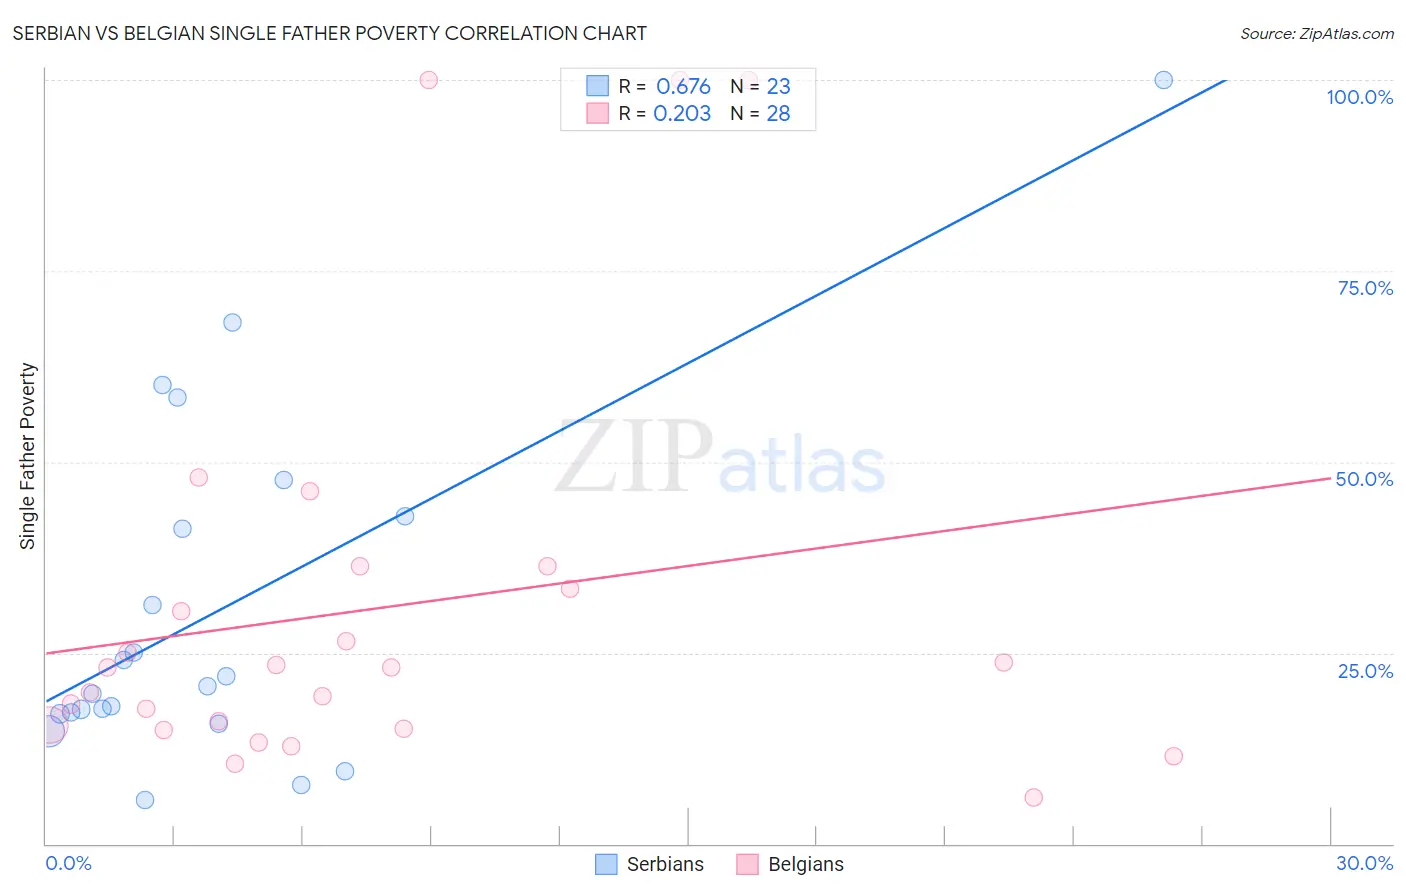
Serbian vs Belgian Single Father Poverty Correlation Chart
The statistical analysis conducted on geographies consisting of 216,450,025 people shows a significant positive correlation between the proportion of Serbians and poverty level among single fathers in the United States with a correlation coefficient (R) of 0.676 and weighted average of 16.4%. Similarly, the statistical analysis conducted on geographies consisting of 276,929,411 people shows a weak positive correlation between the proportion of Belgians and poverty level among single fathers in the United States with a correlation coefficient (R) of 0.203 and weighted average of 16.8%, a difference of 2.8%.
Single Father Poverty Correlation Summary
| Measurement | Serbian | Belgian |
| Minimum | 5.7% | 6.1% |
| Maximum | 100.0% | 100.0% |
| Range | 94.3% | 93.9% |
| Mean | 30.5% | 30.9% |
| Median | 20.7% | 23.0% |
| Interquartile 25% (IQ1) | 17.0% | 15.3% |
| Interquartile 75% (IQ3) | 42.9% | 34.8% |
| Interquartile Range (IQR) | 25.8% | 19.6% |
| Standard Deviation (Sample) | 23.1% | 26.4% |
| Standard Deviation (Population) | 22.6% | 25.9% |
Similar Demographics by Single Father Poverty
Demographics Similar to Serbians by Single Father Poverty
In terms of single father poverty, the demographic groups most similar to Serbians are Immigrants from Cuba (16.4%, a difference of 0.030%), Immigrants from South Africa (16.3%, a difference of 0.15%), Immigrants from Latin America (16.4%, a difference of 0.17%), Immigrants from Western Africa (16.4%, a difference of 0.23%), and Immigrants from Italy (16.4%, a difference of 0.24%).
| Demographics | Rating | Rank | Single Father Poverty |
| Immigrants | Sierra Leone | 50.1 /100 | #172 | Average 16.3% |
| Immigrants | St. Vincent and the Grenadines | 50.0 /100 | #173 | Average 16.3% |
| Swedes | 50.0 /100 | #174 | Average 16.3% |
| Immigrants | Ecuador | 49.7 /100 | #175 | Average 16.3% |
| Vietnamese | 48.0 /100 | #176 | Average 16.3% |
| Immigrants | South Africa | 44.2 /100 | #177 | Average 16.3% |
| Immigrants | Cuba | 41.6 /100 | #178 | Average 16.4% |
| Serbians | 40.9 /100 | #179 | Average 16.4% |
| Immigrants | Latin America | 37.2 /100 | #180 | Fair 16.4% |
| Immigrants | Western Africa | 36.0 /100 | #181 | Fair 16.4% |
| Immigrants | Italy | 35.7 /100 | #182 | Fair 16.4% |
| Aleuts | 35.3 /100 | #183 | Fair 16.4% |
| Cambodians | 34.6 /100 | #184 | Fair 16.4% |
| Panamanians | 33.6 /100 | #185 | Fair 16.4% |
| Immigrants | Venezuela | 31.0 /100 | #186 | Fair 16.4% |
Demographics Similar to Belgians by Single Father Poverty
In terms of single father poverty, the demographic groups most similar to Belgians are British (16.8%, a difference of 0.070%), Hispanic or Latino (16.8%, a difference of 0.16%), Israeli (16.8%, a difference of 0.16%), Immigrants from Trinidad and Tobago (16.8%, a difference of 0.19%), and Menominee (16.8%, a difference of 0.21%).
| Demographics | Rating | Rank | Single Father Poverty |
| Immigrants | Greece | 8.1 /100 | #221 | Tragic 16.7% |
| Immigrants | Spain | 8.0 /100 | #222 | Tragic 16.7% |
| Immigrants | Austria | 7.0 /100 | #223 | Tragic 16.8% |
| Immigrants | Norway | 6.5 /100 | #224 | Tragic 16.8% |
| Menominee | 6.4 /100 | #225 | Tragic 16.8% |
| Hispanics or Latinos | 6.1 /100 | #226 | Tragic 16.8% |
| British | 5.6 /100 | #227 | Tragic 16.8% |
| Belgians | 5.3 /100 | #228 | Tragic 16.8% |
| Israelis | 4.6 /100 | #229 | Tragic 16.8% |
| Immigrants | Trinidad and Tobago | 4.5 /100 | #230 | Tragic 16.8% |
| Spanish Americans | 3.7 /100 | #231 | Tragic 16.9% |
| Immigrants | Grenada | 3.7 /100 | #232 | Tragic 16.9% |
| Senegalese | 3.2 /100 | #233 | Tragic 16.9% |
| Marshallese | 3.1 /100 | #234 | Tragic 16.9% |
| Immigrants | Western Europe | 2.9 /100 | #235 | Tragic 16.9% |