Spanish American vs Swedish Single Mother Poverty
COMPARE
Spanish American
Swedish
Single Mother Poverty
Single Mother Poverty Comparison
Spanish Americans
Swedes
32.3%
SINGLE MOTHER POVERTY
0.0/ 100
METRIC RATING
283rd/ 347
METRIC RANK
28.4%
SINGLE MOTHER POVERTY
89.4/ 100
METRIC RATING
133rd/ 347
METRIC RANK
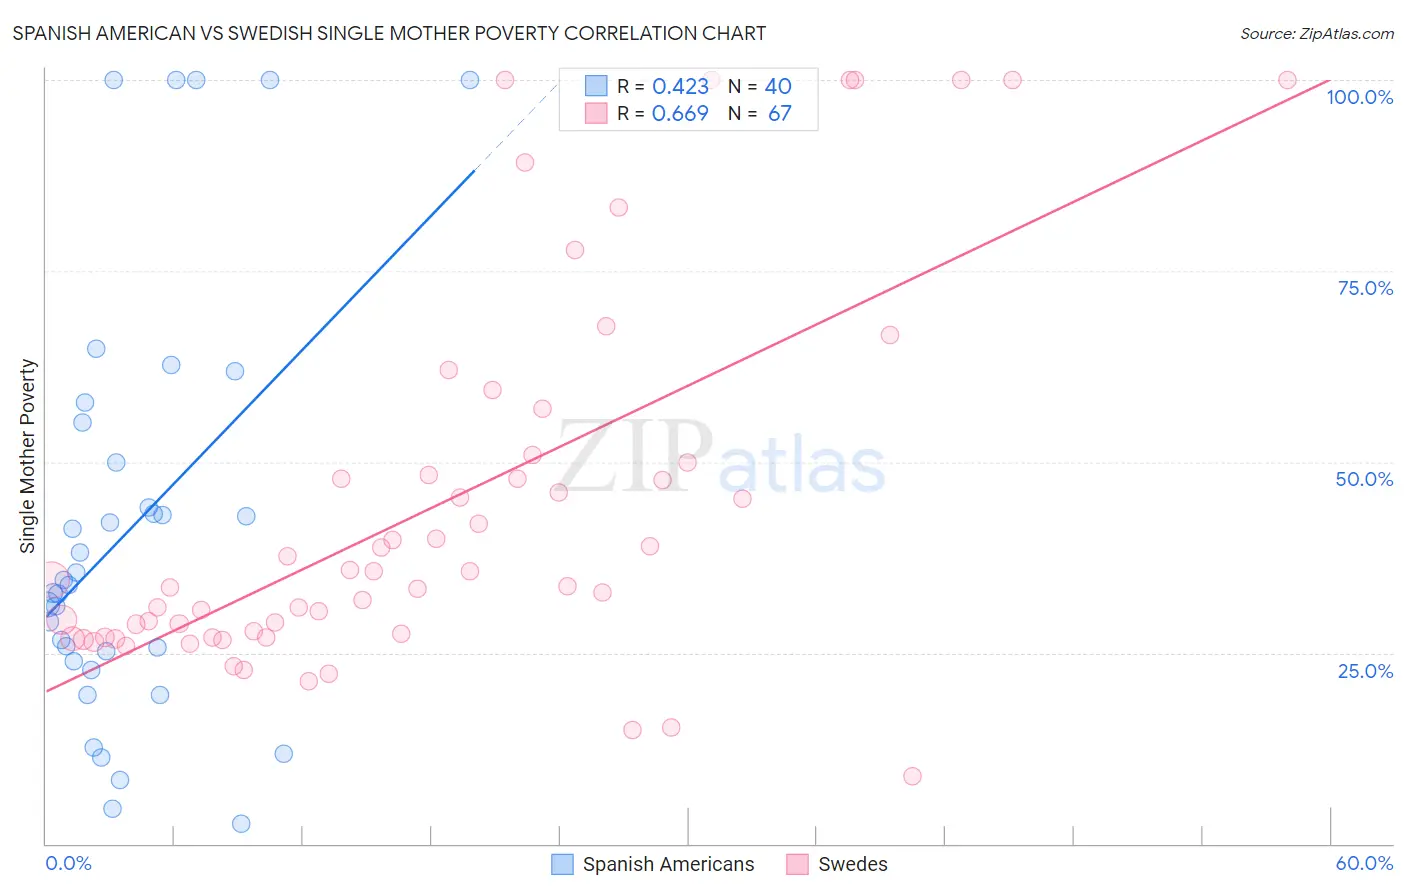
Spanish American vs Swedish Single Mother Poverty Correlation Chart
The statistical analysis conducted on geographies consisting of 102,717,575 people shows a moderate positive correlation between the proportion of Spanish Americans and poverty level among single mothers in the United States with a correlation coefficient (R) of 0.423 and weighted average of 32.3%. Similarly, the statistical analysis conducted on geographies consisting of 514,461,086 people shows a significant positive correlation between the proportion of Swedes and poverty level among single mothers in the United States with a correlation coefficient (R) of 0.669 and weighted average of 28.4%, a difference of 13.6%.
Single Mother Poverty Correlation Summary
| Measurement | Spanish American | Swedish |
| Minimum | 2.6% | 8.8% |
| Maximum | 100.0% | 100.0% |
| Range | 97.4% | 91.2% |
| Mean | 41.2% | 44.1% |
| Median | 34.2% | 34.6% |
| Interquartile 25% (IQ1) | 24.5% | 27.1% |
| Interquartile 75% (IQ3) | 52.6% | 50.0% |
| Interquartile Range (IQR) | 28.0% | 22.9% |
| Standard Deviation (Sample) | 27.2% | 24.6% |
| Standard Deviation (Population) | 26.9% | 24.4% |
Similar Demographics by Single Mother Poverty
Demographics Similar to Spanish Americans by Single Mother Poverty
In terms of single mother poverty, the demographic groups most similar to Spanish Americans are Immigrants from the Azores (32.2%, a difference of 0.25%), Indonesian (32.4%, a difference of 0.30%), Cree (32.2%, a difference of 0.36%), Nonimmigrants (32.2%, a difference of 0.39%), and Immigrants from Latin America (32.4%, a difference of 0.41%).
| Demographics | Rating | Rank | Single Mother Poverty |
| Delaware | 0.0 /100 | #276 | Tragic 31.8% |
| Mexican American Indians | 0.0 /100 | #277 | Tragic 31.9% |
| Immigrants | Zaire | 0.0 /100 | #278 | Tragic 32.0% |
| Marshallese | 0.0 /100 | #279 | Tragic 32.1% |
| Immigrants | Nonimmigrants | 0.0 /100 | #280 | Tragic 32.2% |
| Cree | 0.0 /100 | #281 | Tragic 32.2% |
| Immigrants | Azores | 0.0 /100 | #282 | Tragic 32.2% |
| Spanish Americans | 0.0 /100 | #283 | Tragic 32.3% |
| Indonesians | 0.0 /100 | #284 | Tragic 32.4% |
| Immigrants | Latin America | 0.0 /100 | #285 | Tragic 32.4% |
| Yup'ik | 0.0 /100 | #286 | Tragic 32.5% |
| Immigrants | Dominica | 0.0 /100 | #287 | Tragic 32.5% |
| Somalis | 0.0 /100 | #288 | Tragic 32.6% |
| U.S. Virgin Islanders | 0.0 /100 | #289 | Tragic 32.6% |
| Osage | 0.0 /100 | #290 | Tragic 32.6% |
Demographics Similar to Swedes by Single Mother Poverty
In terms of single mother poverty, the demographic groups most similar to Swedes are Immigrants from Morocco (28.4%, a difference of 0.0%), Immigrants from Southern Europe (28.4%, a difference of 0.030%), Immigrants from Spain (28.4%, a difference of 0.030%), Native Hawaiian (28.4%, a difference of 0.060%), and Immigrants from Canada (28.4%, a difference of 0.070%).
| Demographics | Rating | Rank | Single Mother Poverty |
| Immigrants | Chile | 90.8 /100 | #126 | Exceptional 28.4% |
| Poles | 90.8 /100 | #127 | Exceptional 28.4% |
| Immigrants | England | 90.5 /100 | #128 | Exceptional 28.4% |
| South Americans | 90.4 /100 | #129 | Exceptional 28.4% |
| Norwegians | 90.4 /100 | #130 | Exceptional 28.4% |
| Immigrants | Austria | 90.3 /100 | #131 | Exceptional 28.4% |
| Immigrants | Morocco | 89.5 /100 | #132 | Excellent 28.4% |
| Swedes | 89.4 /100 | #133 | Excellent 28.4% |
| Immigrants | Southern Europe | 89.2 /100 | #134 | Excellent 28.4% |
| Immigrants | Spain | 89.2 /100 | #135 | Excellent 28.4% |
| Native Hawaiians | 88.9 /100 | #136 | Excellent 28.4% |
| Immigrants | Canada | 88.9 /100 | #137 | Excellent 28.4% |
| Immigrants | Belgium | 88.5 /100 | #138 | Excellent 28.5% |
| Samoans | 88.1 /100 | #139 | Excellent 28.5% |
| Immigrants | Colombia | 88.0 /100 | #140 | Excellent 28.5% |