Senegalese vs Immigrants from Guatemala Single Female Poverty
COMPARE
Senegalese
Immigrants from Guatemala
Single Female Poverty
Single Female Poverty Comparison
Senegalese
Immigrants from Guatemala
23.0%
SINGLE FEMALE POVERTY
0.2/ 100
METRIC RATING
267th/ 347
METRIC RANK
24.1%
SINGLE FEMALE POVERTY
0.0/ 100
METRIC RATING
285th/ 347
METRIC RANK
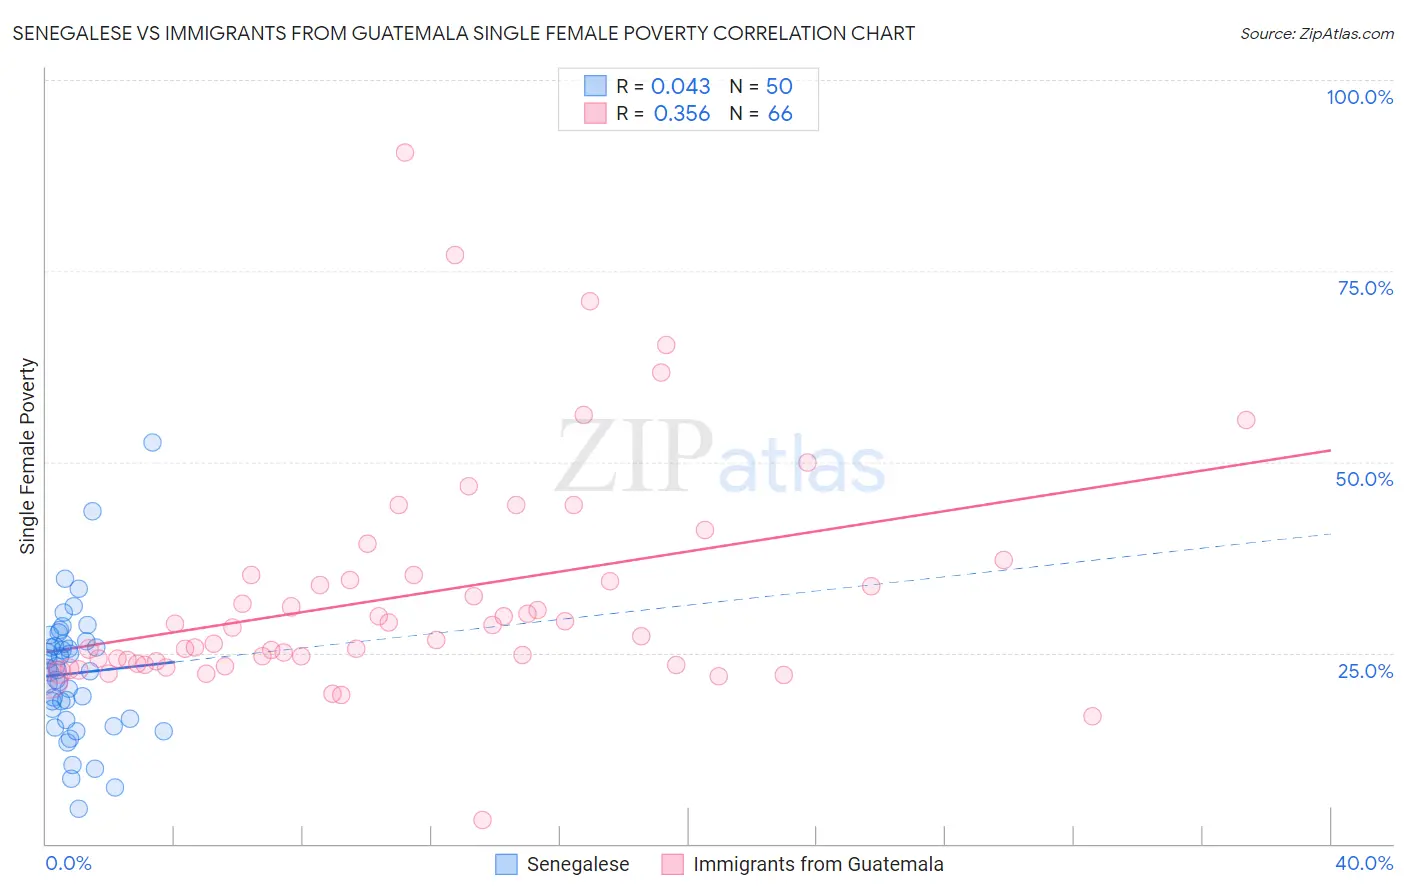
Senegalese vs Immigrants from Guatemala Single Female Poverty Correlation Chart
The statistical analysis conducted on geographies consisting of 77,927,948 people shows no correlation between the proportion of Senegalese and poverty level among single females in the United States with a correlation coefficient (R) of 0.043 and weighted average of 23.0%. Similarly, the statistical analysis conducted on geographies consisting of 373,364,568 people shows a mild positive correlation between the proportion of Immigrants from Guatemala and poverty level among single females in the United States with a correlation coefficient (R) of 0.356 and weighted average of 24.1%, a difference of 4.6%.
Single Female Poverty Correlation Summary
| Measurement | Senegalese | Immigrants from Guatemala |
| Minimum | 4.5% | 3.0% |
| Maximum | 52.6% | 90.5% |
| Range | 48.1% | 87.4% |
| Mean | 22.3% | 32.5% |
| Median | 22.7% | 27.7% |
| Interquartile 25% (IQ1) | 16.3% | 23.6% |
| Interquartile 75% (IQ3) | 26.2% | 35.1% |
| Interquartile Range (IQR) | 9.9% | 11.5% |
| Standard Deviation (Sample) | 8.6% | 15.0% |
| Standard Deviation (Population) | 8.5% | 14.9% |
Demographics Similar to Senegalese and Immigrants from Guatemala by Single Female Poverty
In terms of single female poverty, the demographic groups most similar to Senegalese are Immigrants from Micronesia (23.0%, a difference of 0.060%), Fijian (23.1%, a difference of 0.070%), Hmong (23.1%, a difference of 0.10%), Inupiat (23.1%, a difference of 0.35%), and Subsaharan African (23.2%, a difference of 0.60%). Similarly, the demographic groups most similar to Immigrants from Guatemala are Cree (24.1%, a difference of 0.040%), Immigrants from Dominica (23.9%, a difference of 0.86%), German Russian (23.9%, a difference of 0.97%), Guatemalan (23.8%, a difference of 1.1%), and Immigrants from Zaire (23.8%, a difference of 1.2%).
| Demographics | Rating | Rank | Single Female Poverty |
| Immigrants | Micronesia | 0.2 /100 | #266 | Tragic 23.0% |
| Senegalese | 0.2 /100 | #267 | Tragic 23.0% |
| Fijians | 0.2 /100 | #268 | Tragic 23.1% |
| Hmong | 0.2 /100 | #269 | Tragic 23.1% |
| Inupiat | 0.2 /100 | #270 | Tragic 23.1% |
| Sub-Saharan Africans | 0.1 /100 | #271 | Tragic 23.2% |
| Immigrants | Senegal | 0.1 /100 | #272 | Tragic 23.2% |
| Alaska Natives | 0.1 /100 | #273 | Tragic 23.3% |
| Marshallese | 0.1 /100 | #274 | Tragic 23.3% |
| Mexican American Indians | 0.1 /100 | #275 | Tragic 23.4% |
| Immigrants | Azores | 0.0 /100 | #276 | Tragic 23.5% |
| Pennsylvania Germans | 0.0 /100 | #277 | Tragic 23.6% |
| Immigrants | Nonimmigrants | 0.0 /100 | #278 | Tragic 23.6% |
| Alaskan Athabascans | 0.0 /100 | #279 | Tragic 23.6% |
| Immigrants | Latin America | 0.0 /100 | #280 | Tragic 23.7% |
| Immigrants | Zaire | 0.0 /100 | #281 | Tragic 23.8% |
| Guatemalans | 0.0 /100 | #282 | Tragic 23.8% |
| German Russians | 0.0 /100 | #283 | Tragic 23.9% |
| Immigrants | Dominica | 0.0 /100 | #284 | Tragic 23.9% |
| Immigrants | Guatemala | 0.0 /100 | #285 | Tragic 24.1% |
| Cree | 0.0 /100 | #286 | Tragic 24.1% |