Seminole vs Immigrants from Kuwait Median Male Earnings
COMPARE
Seminole
Immigrants from Kuwait
Median Male Earnings
Median Male Earnings Comparison
Seminole
Immigrants from Kuwait
$46,783
MEDIAN MALE EARNINGS
0.1/ 100
METRIC RATING
302nd/ 347
METRIC RANK
$57,562
MEDIAN MALE EARNINGS
95.3/ 100
METRIC RATING
114th/ 347
METRIC RANK
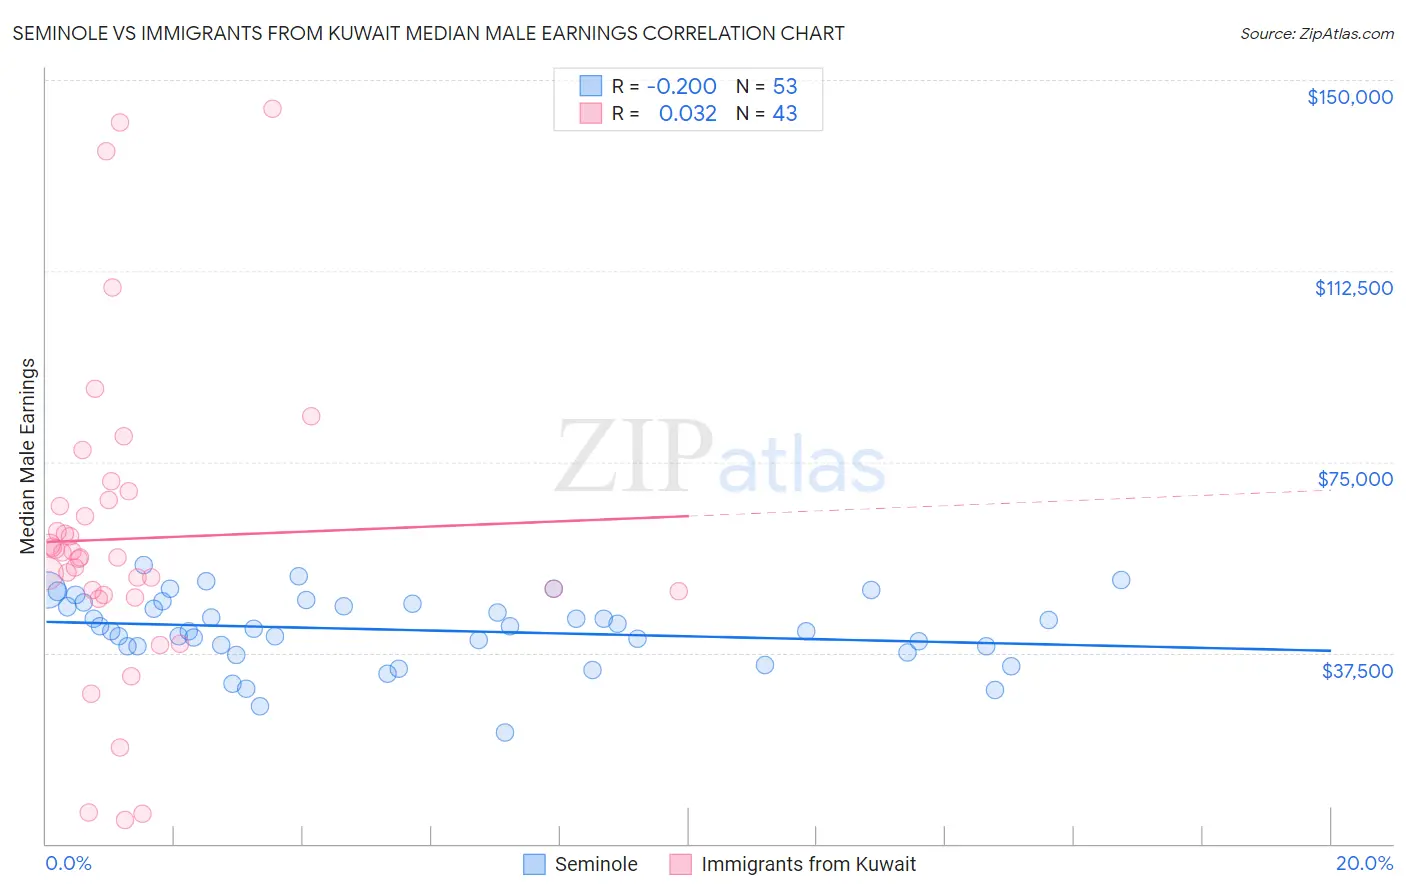
Seminole vs Immigrants from Kuwait Median Male Earnings Correlation Chart
The statistical analysis conducted on geographies consisting of 118,283,332 people shows a poor negative correlation between the proportion of Seminole and median male earnings in the United States with a correlation coefficient (R) of -0.200 and weighted average of $46,783. Similarly, the statistical analysis conducted on geographies consisting of 136,917,085 people shows no correlation between the proportion of Immigrants from Kuwait and median male earnings in the United States with a correlation coefficient (R) of 0.032 and weighted average of $57,562, a difference of 23.0%.
Median Male Earnings Correlation Summary
| Measurement | Seminole | Immigrants from Kuwait |
| Minimum | $21,845 | $4,638 |
| Maximum | $54,701 | $144,236 |
| Range | $32,856 | $139,598 |
| Mean | $41,991 | $59,941 |
| Median | $42,165 | $56,335 |
| Interquartile 25% (IQ1) | $38,676 | $48,946 |
| Interquartile 75% (IQ3) | $47,251 | $67,515 |
| Interquartile Range (IQR) | $8,575 | $18,568 |
| Standard Deviation (Sample) | $6,861 | $30,286 |
| Standard Deviation (Population) | $6,796 | $29,932 |
Similar Demographics by Median Male Earnings
Demographics Similar to Seminole by Median Male Earnings
In terms of median male earnings, the demographic groups most similar to Seminole are Yaqui ($46,777, a difference of 0.010%), Bangladeshi ($46,744, a difference of 0.080%), Guatemalan ($46,736, a difference of 0.10%), Dutch West Indian ($46,656, a difference of 0.27%), and Immigrants from Dominican Republic ($46,655, a difference of 0.27%).
| Demographics | Rating | Rank | Median Male Earnings |
| Central American Indians | 0.1 /100 | #295 | Tragic $47,433 |
| Inupiat | 0.1 /100 | #296 | Tragic $47,281 |
| Dominicans | 0.1 /100 | #297 | Tragic $47,204 |
| Immigrants | Micronesia | 0.1 /100 | #298 | Tragic $47,177 |
| Immigrants | Zaire | 0.1 /100 | #299 | Tragic $47,070 |
| U.S. Virgin Islanders | 0.1 /100 | #300 | Tragic $47,066 |
| Immigrants | Latin America | 0.1 /100 | #301 | Tragic $46,941 |
| Seminole | 0.1 /100 | #302 | Tragic $46,783 |
| Yaqui | 0.1 /100 | #303 | Tragic $46,777 |
| Bangladeshis | 0.1 /100 | #304 | Tragic $46,744 |
| Guatemalans | 0.0 /100 | #305 | Tragic $46,736 |
| Dutch West Indians | 0.0 /100 | #306 | Tragic $46,656 |
| Immigrants | Dominican Republic | 0.0 /100 | #307 | Tragic $46,655 |
| Ottawa | 0.0 /100 | #308 | Tragic $46,611 |
| Creek | 0.0 /100 | #309 | Tragic $46,594 |
Demographics Similar to Immigrants from Kuwait by Median Male Earnings
In terms of median male earnings, the demographic groups most similar to Immigrants from Kuwait are Carpatho Rusyn ($57,572, a difference of 0.020%), Immigrants from Afghanistan ($57,582, a difference of 0.040%), European ($57,637, a difference of 0.13%), Swedish ($57,445, a difference of 0.20%), and Lebanese ($57,409, a difference of 0.27%).
| Demographics | Rating | Rank | Median Male Earnings |
| Serbians | 96.8 /100 | #107 | Exceptional $57,975 |
| Immigrants | Uzbekistan | 96.7 /100 | #108 | Exceptional $57,941 |
| British | 96.5 /100 | #109 | Exceptional $57,890 |
| Palestinians | 96.2 /100 | #110 | Exceptional $57,778 |
| Europeans | 95.6 /100 | #111 | Exceptional $57,637 |
| Immigrants | Afghanistan | 95.4 /100 | #112 | Exceptional $57,582 |
| Carpatho Rusyns | 95.3 /100 | #113 | Exceptional $57,572 |
| Immigrants | Kuwait | 95.3 /100 | #114 | Exceptional $57,562 |
| Swedes | 94.8 /100 | #115 | Exceptional $57,445 |
| Lebanese | 94.6 /100 | #116 | Exceptional $57,409 |
| Immigrants | Zimbabwe | 94.3 /100 | #117 | Exceptional $57,352 |
| Hungarians | 94.0 /100 | #118 | Exceptional $57,309 |
| Arabs | 94.0 /100 | #119 | Exceptional $57,298 |
| Canadians | 93.9 /100 | #120 | Exceptional $57,286 |
| Immigrants | Albania | 93.3 /100 | #121 | Exceptional $57,179 |