Seminole vs Immigrants from Bosnia and Herzegovina Male Poverty
COMPARE
Seminole
Immigrants from Bosnia and Herzegovina
Male Poverty
Male Poverty Comparison
Seminole
Immigrants from Bosnia and Herzegovina
14.3%
MALE POVERTY
0.0/ 100
METRIC RATING
310th/ 347
METRIC RANK
11.0%
MALE POVERTY
65.2/ 100
METRIC RATING
153rd/ 347
METRIC RANK
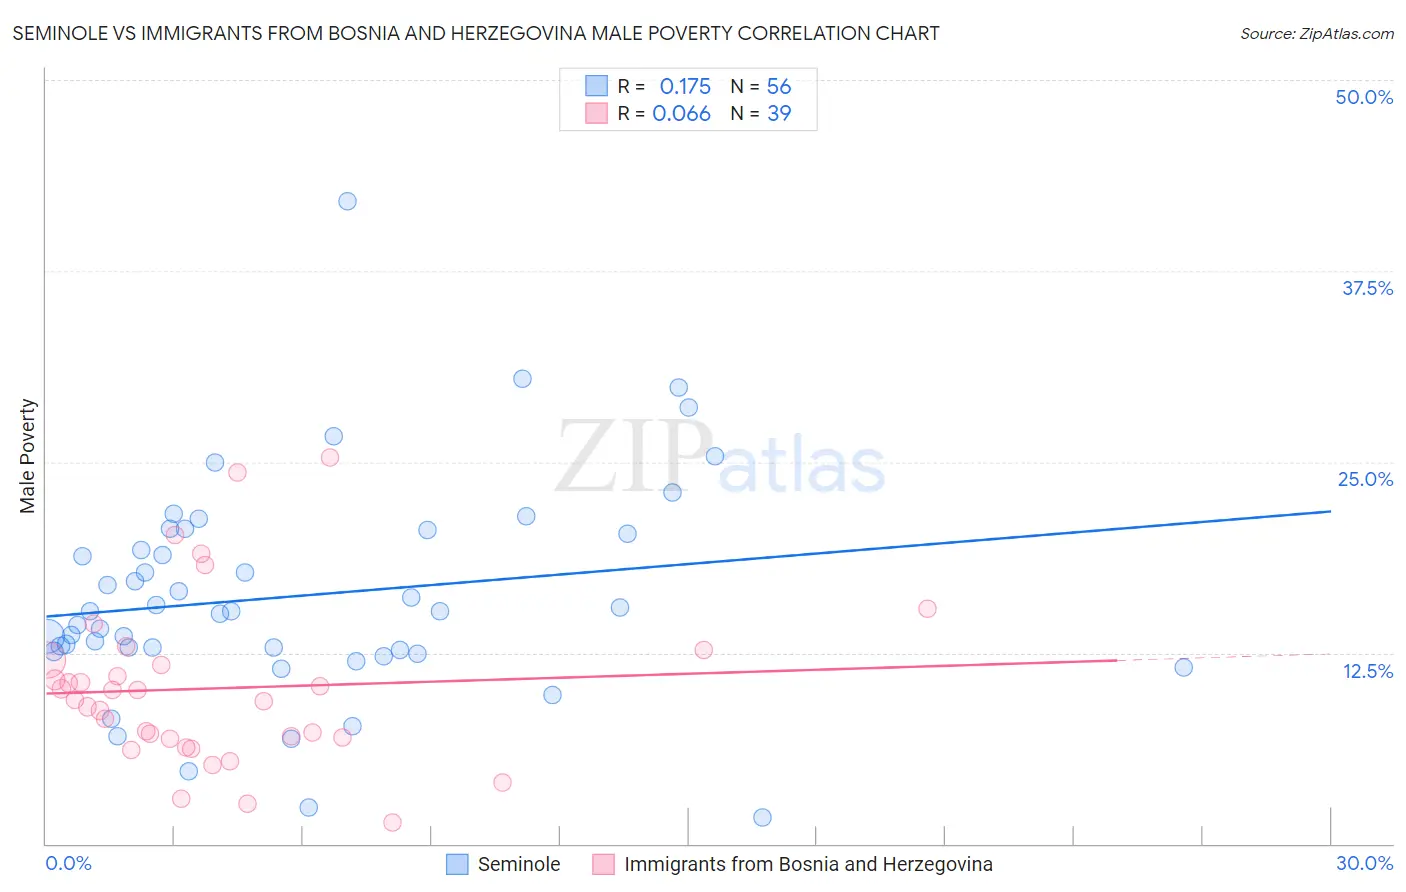
Seminole vs Immigrants from Bosnia and Herzegovina Male Poverty Correlation Chart
The statistical analysis conducted on geographies consisting of 118,283,543 people shows a poor positive correlation between the proportion of Seminole and poverty level among males in the United States with a correlation coefficient (R) of 0.175 and weighted average of 14.3%. Similarly, the statistical analysis conducted on geographies consisting of 156,800,336 people shows a slight positive correlation between the proportion of Immigrants from Bosnia and Herzegovina and poverty level among males in the United States with a correlation coefficient (R) of 0.066 and weighted average of 11.0%, a difference of 29.7%.
Male Poverty Correlation Summary
| Measurement | Seminole | Immigrants from Bosnia and Herzegovina |
| Minimum | 1.7% | 1.4% |
| Maximum | 42.0% | 25.3% |
| Range | 40.3% | 23.9% |
| Mean | 16.2% | 10.2% |
| Median | 15.2% | 9.4% |
| Interquartile 25% (IQ1) | 12.6% | 6.9% |
| Interquartile 75% (IQ3) | 20.4% | 12.0% |
| Interquartile Range (IQR) | 7.8% | 5.1% |
| Standard Deviation (Sample) | 7.1% | 5.4% |
| Standard Deviation (Population) | 7.1% | 5.4% |
Similar Demographics by Male Poverty
Demographics Similar to Seminole by Male Poverty
In terms of male poverty, the demographic groups most similar to Seminole are Somali (14.3%, a difference of 0.20%), Honduran (14.3%, a difference of 0.21%), African (14.2%, a difference of 0.58%), Dutch West Indian (14.2%, a difference of 0.60%), and Choctaw (14.4%, a difference of 0.67%).
| Demographics | Rating | Rank | Male Poverty |
| Bahamians | 0.0 /100 | #303 | Tragic 14.1% |
| Senegalese | 0.0 /100 | #304 | Tragic 14.1% |
| Immigrants | Bangladesh | 0.0 /100 | #305 | Tragic 14.1% |
| Creek | 0.0 /100 | #306 | Tragic 14.1% |
| Dutch West Indians | 0.0 /100 | #307 | Tragic 14.2% |
| Africans | 0.0 /100 | #308 | Tragic 14.2% |
| Somalis | 0.0 /100 | #309 | Tragic 14.3% |
| Seminole | 0.0 /100 | #310 | Tragic 14.3% |
| Hondurans | 0.0 /100 | #311 | Tragic 14.3% |
| Choctaw | 0.0 /100 | #312 | Tragic 14.4% |
| Immigrants | Somalia | 0.0 /100 | #313 | Tragic 14.6% |
| Immigrants | Honduras | 0.0 /100 | #314 | Tragic 14.6% |
| Chippewa | 0.0 /100 | #315 | Tragic 14.6% |
| British West Indians | 0.0 /100 | #316 | Tragic 14.6% |
| Immigrants | Dominica | 0.0 /100 | #317 | Tragic 14.7% |
Demographics Similar to Immigrants from Bosnia and Herzegovina by Male Poverty
In terms of male poverty, the demographic groups most similar to Immigrants from Bosnia and Herzegovina are Immigrants from Kazakhstan (11.0%, a difference of 0.050%), Immigrants from Malaysia (11.0%, a difference of 0.050%), Costa Rican (11.0%, a difference of 0.15%), Scotch-Irish (11.0%, a difference of 0.17%), and Immigrants from Nepal (11.0%, a difference of 0.23%).
| Demographics | Rating | Rank | Male Poverty |
| Syrians | 71.4 /100 | #146 | Good 10.9% |
| Icelanders | 68.5 /100 | #147 | Good 11.0% |
| Armenians | 68.0 /100 | #148 | Good 11.0% |
| Immigrants | Venezuela | 67.9 /100 | #149 | Good 11.0% |
| Guamanians/Chamorros | 67.6 /100 | #150 | Good 11.0% |
| Venezuelans | 67.4 /100 | #151 | Good 11.0% |
| Immigrants | Nepal | 67.3 /100 | #152 | Good 11.0% |
| Immigrants | Bosnia and Herzegovina | 65.2 /100 | #153 | Good 11.0% |
| Immigrants | Kazakhstan | 64.8 /100 | #154 | Good 11.0% |
| Immigrants | Malaysia | 64.7 /100 | #155 | Good 11.0% |
| Costa Ricans | 63.9 /100 | #156 | Good 11.0% |
| Scotch-Irish | 63.7 /100 | #157 | Good 11.0% |
| Colombians | 63.0 /100 | #158 | Good 11.0% |
| Taiwanese | 62.7 /100 | #159 | Good 11.0% |
| Soviet Union | 60.3 /100 | #160 | Good 11.1% |