Seminole vs Liberian Male Poverty
COMPARE
Seminole
Liberian
Male Poverty
Male Poverty Comparison
Seminole
Liberians
14.3%
MALE POVERTY
0.0/ 100
METRIC RATING
310th/ 347
METRIC RANK
12.8%
MALE POVERTY
0.3/ 100
METRIC RATING
245th/ 347
METRIC RANK
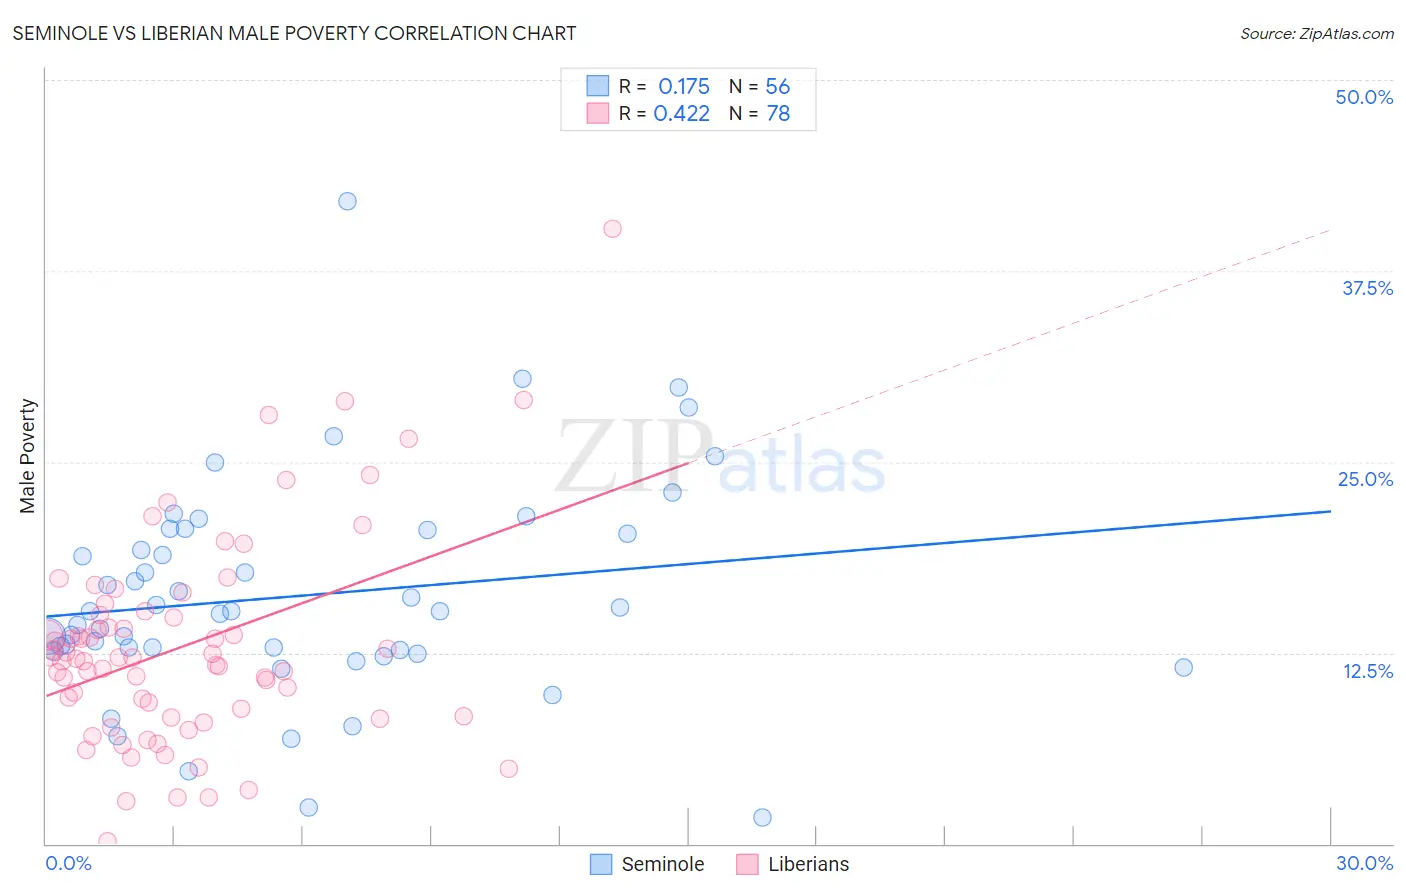
Seminole vs Liberian Male Poverty Correlation Chart
The statistical analysis conducted on geographies consisting of 118,283,543 people shows a poor positive correlation between the proportion of Seminole and poverty level among males in the United States with a correlation coefficient (R) of 0.175 and weighted average of 14.3%. Similarly, the statistical analysis conducted on geographies consisting of 118,033,924 people shows a moderate positive correlation between the proportion of Liberians and poverty level among males in the United States with a correlation coefficient (R) of 0.422 and weighted average of 12.8%, a difference of 11.6%.
Male Poverty Correlation Summary
| Measurement | Seminole | Liberian |
| Minimum | 1.7% | 0.17% |
| Maximum | 42.0% | 40.3% |
| Range | 40.3% | 40.1% |
| Mean | 16.2% | 12.9% |
| Median | 15.2% | 12.1% |
| Interquartile 25% (IQ1) | 12.6% | 8.4% |
| Interquartile 75% (IQ3) | 20.4% | 15.0% |
| Interquartile Range (IQR) | 7.8% | 6.6% |
| Standard Deviation (Sample) | 7.1% | 6.8% |
| Standard Deviation (Population) | 7.1% | 6.8% |
Similar Demographics by Male Poverty
Demographics Similar to Seminole by Male Poverty
In terms of male poverty, the demographic groups most similar to Seminole are Somali (14.3%, a difference of 0.20%), Honduran (14.3%, a difference of 0.21%), African (14.2%, a difference of 0.58%), Dutch West Indian (14.2%, a difference of 0.60%), and Choctaw (14.4%, a difference of 0.67%).
| Demographics | Rating | Rank | Male Poverty |
| Bahamians | 0.0 /100 | #303 | Tragic 14.1% |
| Senegalese | 0.0 /100 | #304 | Tragic 14.1% |
| Immigrants | Bangladesh | 0.0 /100 | #305 | Tragic 14.1% |
| Creek | 0.0 /100 | #306 | Tragic 14.1% |
| Dutch West Indians | 0.0 /100 | #307 | Tragic 14.2% |
| Africans | 0.0 /100 | #308 | Tragic 14.2% |
| Somalis | 0.0 /100 | #309 | Tragic 14.3% |
| Seminole | 0.0 /100 | #310 | Tragic 14.3% |
| Hondurans | 0.0 /100 | #311 | Tragic 14.3% |
| Choctaw | 0.0 /100 | #312 | Tragic 14.4% |
| Immigrants | Somalia | 0.0 /100 | #313 | Tragic 14.6% |
| Immigrants | Honduras | 0.0 /100 | #314 | Tragic 14.6% |
| Chippewa | 0.0 /100 | #315 | Tragic 14.6% |
| British West Indians | 0.0 /100 | #316 | Tragic 14.6% |
| Immigrants | Dominica | 0.0 /100 | #317 | Tragic 14.7% |
Demographics Similar to Liberians by Male Poverty
In terms of male poverty, the demographic groups most similar to Liberians are Tsimshian (12.8%, a difference of 0.010%), Alaskan Athabascan (12.8%, a difference of 0.12%), Nepalese (12.8%, a difference of 0.16%), Immigrants from El Salvador (12.8%, a difference of 0.30%), and Sudanese (12.8%, a difference of 0.32%).
| Demographics | Rating | Rank | Male Poverty |
| Ecuadorians | 0.4 /100 | #238 | Tragic 12.7% |
| Ghanaians | 0.4 /100 | #239 | Tragic 12.7% |
| Immigrants | Middle Africa | 0.4 /100 | #240 | Tragic 12.7% |
| Sudanese | 0.3 /100 | #241 | Tragic 12.8% |
| Nepalese | 0.3 /100 | #242 | Tragic 12.8% |
| Alaskan Athabascans | 0.3 /100 | #243 | Tragic 12.8% |
| Tsimshian | 0.3 /100 | #244 | Tragic 12.8% |
| Liberians | 0.3 /100 | #245 | Tragic 12.8% |
| Immigrants | El Salvador | 0.2 /100 | #246 | Tragic 12.8% |
| Immigrants | Western Africa | 0.2 /100 | #247 | Tragic 12.9% |
| Immigrants | Sudan | 0.2 /100 | #248 | Tragic 12.9% |
| Potawatomi | 0.2 /100 | #249 | Tragic 12.9% |
| Immigrants | Nicaragua | 0.2 /100 | #250 | Tragic 12.9% |
| Immigrants | Cuba | 0.2 /100 | #251 | Tragic 12.9% |
| Immigrants | Ecuador | 0.2 /100 | #252 | Tragic 12.9% |