Immigrants from Asia vs Immigrants from Guyana Family Poverty
COMPARE
Immigrants from Asia
Immigrants from Guyana
Family Poverty
Family Poverty Comparison
Immigrants from Asia
Immigrants from Guyana
7.9%
FAMILY POVERTY
97.4/ 100
METRIC RATING
85th/ 347
METRIC RANK
11.2%
FAMILY POVERTY
0.1/ 100
METRIC RATING
276th/ 347
METRIC RANK
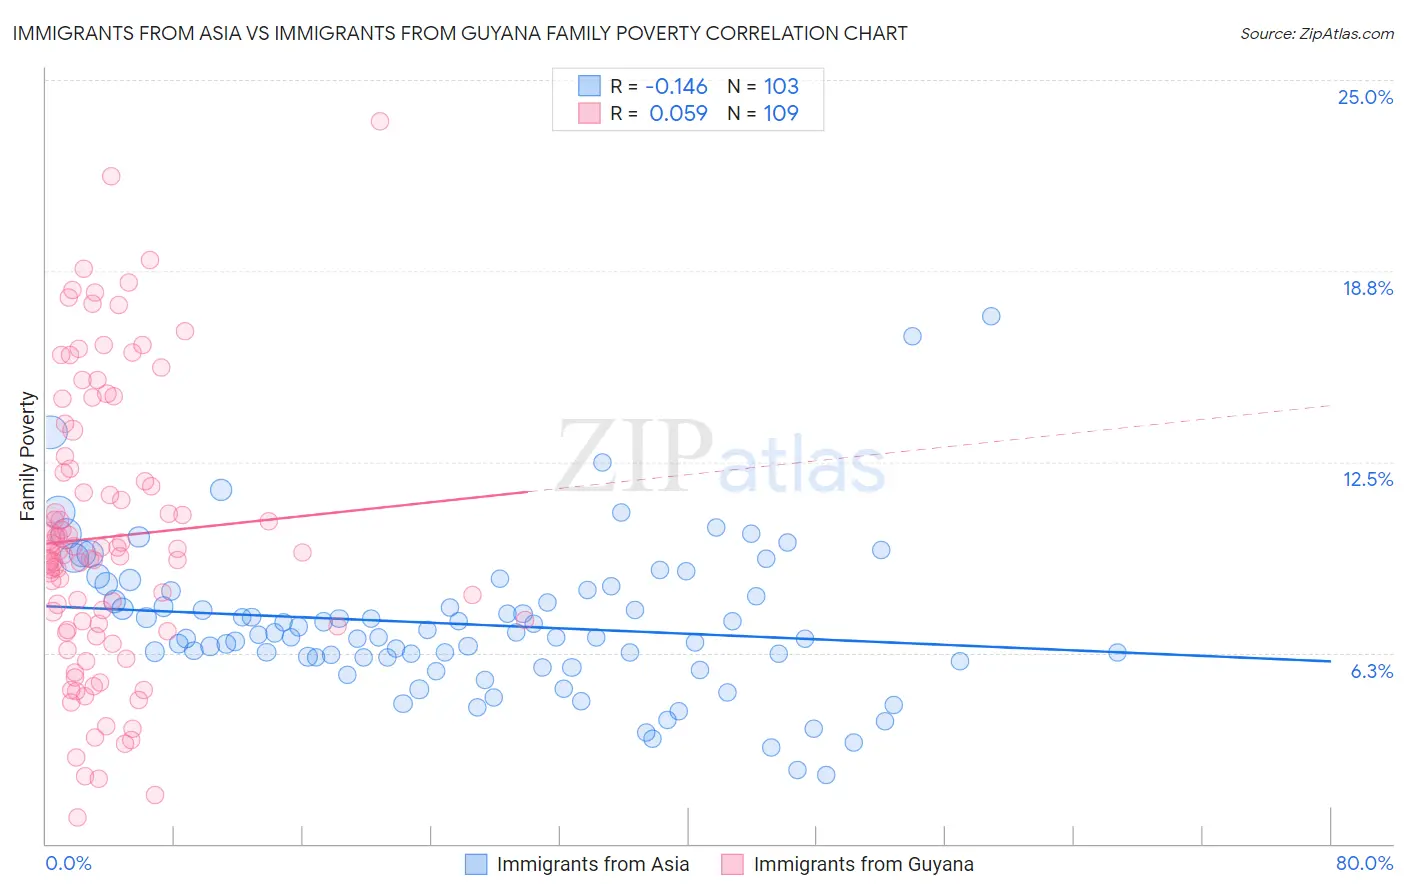
Immigrants from Asia vs Immigrants from Guyana Family Poverty Correlation Chart
The statistical analysis conducted on geographies consisting of 545,488,463 people shows a poor negative correlation between the proportion of Immigrants from Asia and poverty level among families in the United States with a correlation coefficient (R) of -0.146 and weighted average of 7.9%. Similarly, the statistical analysis conducted on geographies consisting of 183,364,556 people shows a slight positive correlation between the proportion of Immigrants from Guyana and poverty level among families in the United States with a correlation coefficient (R) of 0.059 and weighted average of 11.2%, a difference of 41.4%.
Family Poverty Correlation Summary
| Measurement | Immigrants from Asia | Immigrants from Guyana |
| Minimum | 2.2% | 0.84% |
| Maximum | 17.3% | 23.6% |
| Range | 15.0% | 22.8% |
| Mean | 7.2% | 10.0% |
| Median | 6.8% | 9.6% |
| Interquartile 25% (IQ1) | 6.1% | 7.0% |
| Interquartile 75% (IQ3) | 8.3% | 12.5% |
| Interquartile Range (IQR) | 2.2% | 5.5% |
| Standard Deviation (Sample) | 2.5% | 4.6% |
| Standard Deviation (Population) | 2.5% | 4.6% |
Similar Demographics by Family Poverty
Demographics Similar to Immigrants from Asia by Family Poverty
In terms of family poverty, the demographic groups most similar to Immigrants from Asia are Scottish (7.9%, a difference of 0.040%), Belgian (8.0%, a difference of 0.13%), Serbian (8.0%, a difference of 0.20%), British (7.9%, a difference of 0.24%), and Immigrants from Denmark (8.0%, a difference of 0.34%).
| Demographics | Rating | Rank | Family Poverty |
| Immigrants | North America | 97.9 /100 | #78 | Exceptional 7.9% |
| Immigrants | Europe | 97.8 /100 | #79 | Exceptional 7.9% |
| English | 97.8 /100 | #80 | Exceptional 7.9% |
| Irish | 97.8 /100 | #81 | Exceptional 7.9% |
| Immigrants | Poland | 97.8 /100 | #82 | Exceptional 7.9% |
| Slovaks | 97.7 /100 | #83 | Exceptional 7.9% |
| British | 97.5 /100 | #84 | Exceptional 7.9% |
| Immigrants | Asia | 97.4 /100 | #85 | Exceptional 7.9% |
| Scottish | 97.3 /100 | #86 | Exceptional 7.9% |
| Belgians | 97.3 /100 | #87 | Exceptional 8.0% |
| Serbians | 97.2 /100 | #88 | Exceptional 8.0% |
| Immigrants | Denmark | 97.1 /100 | #89 | Exceptional 8.0% |
| Immigrants | England | 97.1 /100 | #90 | Exceptional 8.0% |
| Immigrants | Italy | 97.0 /100 | #91 | Exceptional 8.0% |
| Czechoslovakians | 96.8 /100 | #92 | Exceptional 8.0% |
Demographics Similar to Immigrants from Guyana by Family Poverty
In terms of family poverty, the demographic groups most similar to Immigrants from Guyana are Central American (11.2%, a difference of 0.020%), Spanish American (11.2%, a difference of 0.070%), Chippewa (11.2%, a difference of 0.090%), Guyanese (11.2%, a difference of 0.12%), and Somali (11.2%, a difference of 0.16%).
| Demographics | Rating | Rank | Family Poverty |
| Immigrants | Ecuador | 0.1 /100 | #269 | Tragic 11.1% |
| Immigrants | Nicaragua | 0.1 /100 | #270 | Tragic 11.1% |
| Immigrants | Bahamas | 0.1 /100 | #271 | Tragic 11.1% |
| Immigrants | Jamaica | 0.1 /100 | #272 | Tragic 11.2% |
| Somalis | 0.1 /100 | #273 | Tragic 11.2% |
| Spanish Americans | 0.1 /100 | #274 | Tragic 11.2% |
| Central Americans | 0.1 /100 | #275 | Tragic 11.2% |
| Immigrants | Guyana | 0.1 /100 | #276 | Tragic 11.2% |
| Chippewa | 0.1 /100 | #277 | Tragic 11.2% |
| Guyanese | 0.1 /100 | #278 | Tragic 11.2% |
| Blackfeet | 0.0 /100 | #279 | Tragic 11.3% |
| Belizeans | 0.0 /100 | #280 | Tragic 11.3% |
| Immigrants | West Indies | 0.0 /100 | #281 | Tragic 11.3% |
| Immigrants | Cuba | 0.0 /100 | #282 | Tragic 11.3% |
| Indonesians | 0.0 /100 | #283 | Tragic 11.3% |