South American vs U.S. Virgin Islander Single Female Poverty
COMPARE
South American
U.S. Virgin Islander
Single Female Poverty
Single Female Poverty Comparison
South Americans
U.S. Virgin Islanders
20.0%
SINGLE FEMALE POVERTY
95.1/ 100
METRIC RATING
120th/ 347
METRIC RANK
24.2%
SINGLE FEMALE POVERTY
0.0/ 100
METRIC RATING
289th/ 347
METRIC RANK
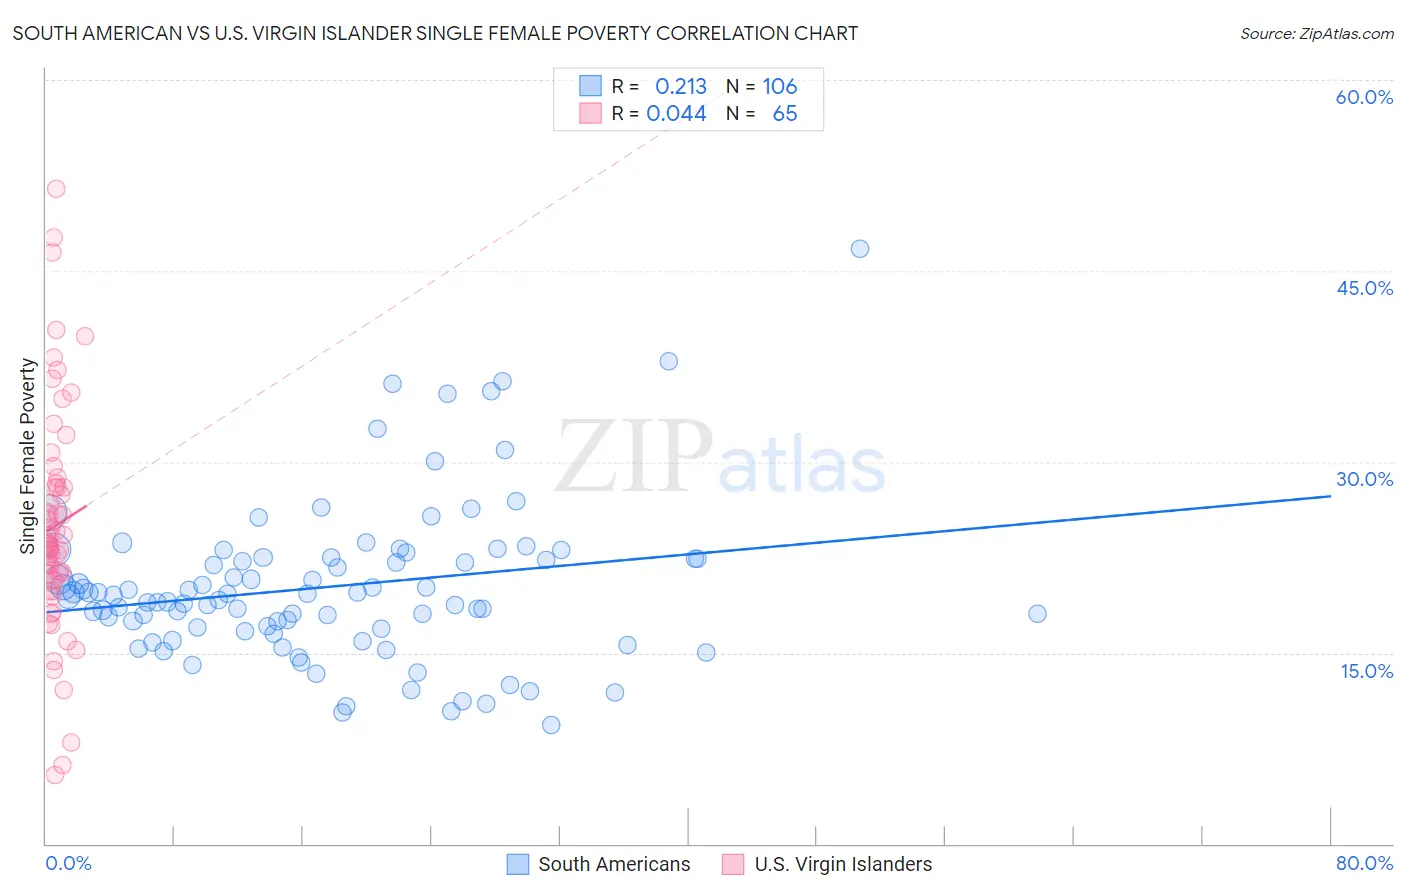
South American vs U.S. Virgin Islander Single Female Poverty Correlation Chart
The statistical analysis conducted on geographies consisting of 482,993,980 people shows a weak positive correlation between the proportion of South Americans and poverty level among single females in the United States with a correlation coefficient (R) of 0.213 and weighted average of 20.0%. Similarly, the statistical analysis conducted on geographies consisting of 87,304,073 people shows no correlation between the proportion of U.S. Virgin Islanders and poverty level among single females in the United States with a correlation coefficient (R) of 0.044 and weighted average of 24.2%, a difference of 20.7%.
Single Female Poverty Correlation Summary
| Measurement | South American | U.S. Virgin Islander |
| Minimum | 9.4% | 5.4% |
| Maximum | 46.7% | 51.4% |
| Range | 37.3% | 46.0% |
| Mean | 20.2% | 25.0% |
| Median | 19.5% | 23.5% |
| Interquartile 25% (IQ1) | 16.9% | 20.7% |
| Interquartile 75% (IQ3) | 22.4% | 28.2% |
| Interquartile Range (IQR) | 5.5% | 7.5% |
| Standard Deviation (Sample) | 6.2% | 8.9% |
| Standard Deviation (Population) | 6.2% | 8.9% |
Similar Demographics by Single Female Poverty
Demographics Similar to South Americans by Single Female Poverty
In terms of single female poverty, the demographic groups most similar to South Americans are Immigrants from Switzerland (20.0%, a difference of 0.030%), Immigrants from South America (20.0%, a difference of 0.060%), Immigrants from Afghanistan (20.0%, a difference of 0.10%), Immigrants from Ethiopia (20.0%, a difference of 0.10%), and Polish (20.0%, a difference of 0.17%).
| Demographics | Rating | Rank | Single Female Poverty |
| Immigrants | Zimbabwe | 95.9 /100 | #113 | Exceptional 20.0% |
| Immigrants | Colombia | 95.9 /100 | #114 | Exceptional 20.0% |
| Immigrants | Northern Africa | 95.8 /100 | #115 | Exceptional 20.0% |
| Immigrants | Kazakhstan | 95.7 /100 | #116 | Exceptional 20.0% |
| Poles | 95.6 /100 | #117 | Exceptional 20.0% |
| Immigrants | Afghanistan | 95.4 /100 | #118 | Exceptional 20.0% |
| Immigrants | Ethiopia | 95.4 /100 | #119 | Exceptional 20.0% |
| South Americans | 95.1 /100 | #120 | Exceptional 20.0% |
| Immigrants | Switzerland | 95.1 /100 | #121 | Exceptional 20.0% |
| Immigrants | South America | 95.0 /100 | #122 | Exceptional 20.0% |
| Brazilians | 94.4 /100 | #123 | Exceptional 20.1% |
| Immigrants | Chile | 94.3 /100 | #124 | Exceptional 20.1% |
| Immigrants | South Africa | 93.9 /100 | #125 | Exceptional 20.1% |
| Serbians | 93.3 /100 | #126 | Exceptional 20.1% |
| Mongolians | 93.2 /100 | #127 | Exceptional 20.2% |
Demographics Similar to U.S. Virgin Islanders by Single Female Poverty
In terms of single female poverty, the demographic groups most similar to U.S. Virgin Islanders are Spanish American (24.2%, a difference of 0.050%), Bangladeshi (24.2%, a difference of 0.070%), Cree (24.1%, a difference of 0.22%), Immigrants from Guatemala (24.1%, a difference of 0.26%), and Indonesian (24.3%, a difference of 0.34%).
| Demographics | Rating | Rank | Single Female Poverty |
| Guatemalans | 0.0 /100 | #282 | Tragic 23.8% |
| German Russians | 0.0 /100 | #283 | Tragic 23.9% |
| Immigrants | Dominica | 0.0 /100 | #284 | Tragic 23.9% |
| Immigrants | Guatemala | 0.0 /100 | #285 | Tragic 24.1% |
| Cree | 0.0 /100 | #286 | Tragic 24.1% |
| Bangladeshis | 0.0 /100 | #287 | Tragic 24.2% |
| Spanish Americans | 0.0 /100 | #288 | Tragic 24.2% |
| U.S. Virgin Islanders | 0.0 /100 | #289 | Tragic 24.2% |
| Indonesians | 0.0 /100 | #290 | Tragic 24.3% |
| Osage | 0.0 /100 | #291 | Tragic 24.4% |
| Alsatians | 0.0 /100 | #292 | Tragic 24.5% |
| Americans | 0.0 /100 | #293 | Tragic 24.5% |
| French American Indians | 0.0 /100 | #294 | Tragic 24.6% |
| Hispanics or Latinos | 0.0 /100 | #295 | Tragic 24.6% |
| Africans | 0.0 /100 | #296 | Tragic 24.8% |