Scotch-Irish vs Immigrants from Moldova Child Poverty Among Boys Under 16
COMPARE
Scotch-Irish
Immigrants from Moldova
Child Poverty Among Boys Under 16
Child Poverty Among Boys Under 16 Comparison
Scotch-Irish
Immigrants from Moldova
16.5%
CHILD POVERTY AMONG BOYS UNDER 16
47.5/ 100
METRIC RATING
178th/ 347
METRIC RANK
14.1%
CHILD POVERTY AMONG BOYS UNDER 16
99.4/ 100
METRIC RATING
47th/ 347
METRIC RANK
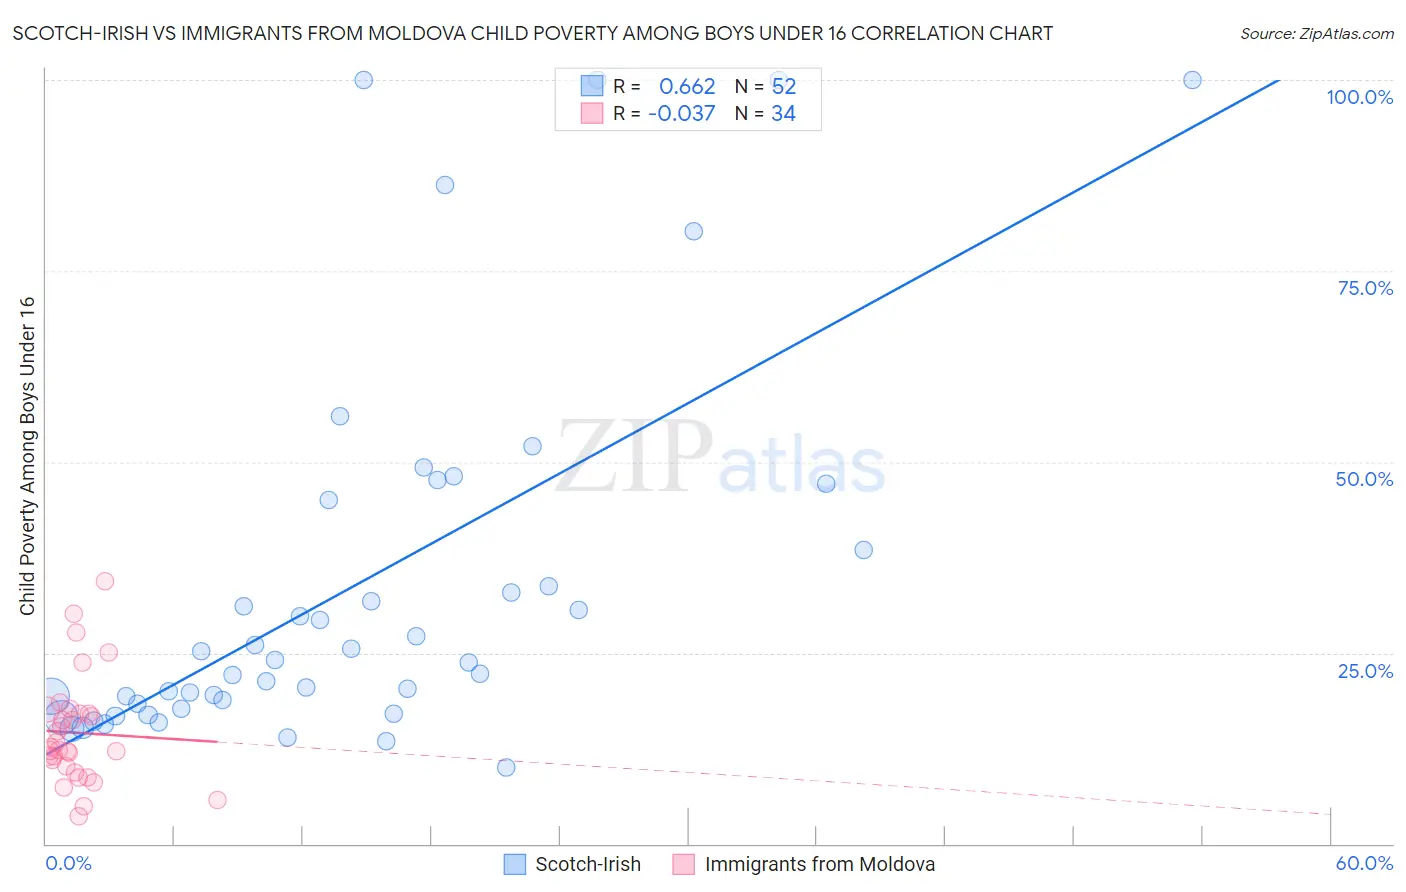
Scotch-Irish vs Immigrants from Moldova Child Poverty Among Boys Under 16 Correlation Chart
The statistical analysis conducted on geographies consisting of 530,822,758 people shows a significant positive correlation between the proportion of Scotch-Irish and poverty level among boys under the age of 16 in the United States with a correlation coefficient (R) of 0.662 and weighted average of 16.5%. Similarly, the statistical analysis conducted on geographies consisting of 123,426,416 people shows no correlation between the proportion of Immigrants from Moldova and poverty level among boys under the age of 16 in the United States with a correlation coefficient (R) of -0.037 and weighted average of 14.1%, a difference of 16.7%.
Child Poverty Among Boys Under 16 Correlation Summary
| Measurement | Scotch-Irish | Immigrants from Moldova |
| Minimum | 10.0% | 3.6% |
| Maximum | 100.0% | 34.4% |
| Range | 90.0% | 30.8% |
| Mean | 33.9% | 14.5% |
| Median | 23.9% | 12.4% |
| Interquartile 25% (IQ1) | 18.0% | 10.1% |
| Interquartile 75% (IQ3) | 41.8% | 17.1% |
| Interquartile Range (IQR) | 23.8% | 6.9% |
| Standard Deviation (Sample) | 24.8% | 7.0% |
| Standard Deviation (Population) | 24.6% | 6.9% |
Similar Demographics by Child Poverty Among Boys Under 16
Demographics Similar to Scotch-Irish by Child Poverty Among Boys Under 16
In terms of child poverty among boys under 16, the demographic groups most similar to Scotch-Irish are Hungarian (16.5%, a difference of 0.020%), Ethiopian (16.5%, a difference of 0.040%), White/Caucasian (16.5%, a difference of 0.080%), Immigrants from Syria (16.5%, a difference of 0.17%), and Hawaiian (16.5%, a difference of 0.22%).
| Demographics | Rating | Rank | Child Poverty Among Boys Under 16 |
| Immigrants | Ethiopia | 51.3 /100 | #171 | Average 16.4% |
| Immigrants | Colombia | 50.8 /100 | #172 | Average 16.4% |
| Tsimshian | 50.5 /100 | #173 | Average 16.4% |
| Uruguayans | 50.0 /100 | #174 | Average 16.4% |
| Immigrants | Syria | 49.0 /100 | #175 | Average 16.5% |
| Whites/Caucasians | 48.2 /100 | #176 | Average 16.5% |
| Ethiopians | 47.8 /100 | #177 | Average 16.5% |
| Scotch-Irish | 47.5 /100 | #178 | Average 16.5% |
| Hungarians | 47.3 /100 | #179 | Average 16.5% |
| Hawaiians | 45.5 /100 | #180 | Average 16.5% |
| South American Indians | 44.3 /100 | #181 | Average 16.5% |
| Lebanese | 43.3 /100 | #182 | Average 16.6% |
| Kenyans | 41.0 /100 | #183 | Average 16.6% |
| Celtics | 40.6 /100 | #184 | Average 16.6% |
| Immigrants | Western Asia | 40.4 /100 | #185 | Average 16.6% |
Demographics Similar to Immigrants from Moldova by Child Poverty Among Boys Under 16
In terms of child poverty among boys under 16, the demographic groups most similar to Immigrants from Moldova are Immigrants from Indonesia (14.1%, a difference of 0.020%), Czech (14.1%, a difference of 0.11%), Greek (14.1%, a difference of 0.27%), Immigrants from Scotland (14.1%, a difference of 0.37%), and Estonian (14.1%, a difference of 0.47%).
| Demographics | Rating | Rank | Child Poverty Among Boys Under 16 |
| Immigrants | Asia | 99.6 /100 | #40 | Exceptional 13.9% |
| Lithuanians | 99.6 /100 | #41 | Exceptional 14.0% |
| Koreans | 99.6 /100 | #42 | Exceptional 14.0% |
| Croatians | 99.5 /100 | #43 | Exceptional 14.0% |
| Estonians | 99.4 /100 | #44 | Exceptional 14.1% |
| Immigrants | Scotland | 99.4 /100 | #45 | Exceptional 14.1% |
| Greeks | 99.4 /100 | #46 | Exceptional 14.1% |
| Immigrants | Moldova | 99.4 /100 | #47 | Exceptional 14.1% |
| Immigrants | Indonesia | 99.4 /100 | #48 | Exceptional 14.1% |
| Czechs | 99.3 /100 | #49 | Exceptional 14.1% |
| Italians | 99.2 /100 | #50 | Exceptional 14.2% |
| Immigrants | Greece | 99.2 /100 | #51 | Exceptional 14.2% |
| Laotians | 99.0 /100 | #52 | Exceptional 14.3% |
| Immigrants | Philippines | 99.0 /100 | #53 | Exceptional 14.3% |
| Immigrants | Serbia | 99.0 /100 | #54 | Exceptional 14.3% |