Hawaiian vs Indonesian Child Poverty Among Boys Under 16
COMPARE
Hawaiian
Indonesian
Child Poverty Among Boys Under 16
Child Poverty Among Boys Under 16 Comparison
Hawaiians
Indonesians
16.5%
CHILD POVERTY AMONG BOYS UNDER 16
45.5/ 100
METRIC RATING
180th/ 347
METRIC RANK
20.8%
CHILD POVERTY AMONG BOYS UNDER 16
0.0/ 100
METRIC RATING
296th/ 347
METRIC RANK
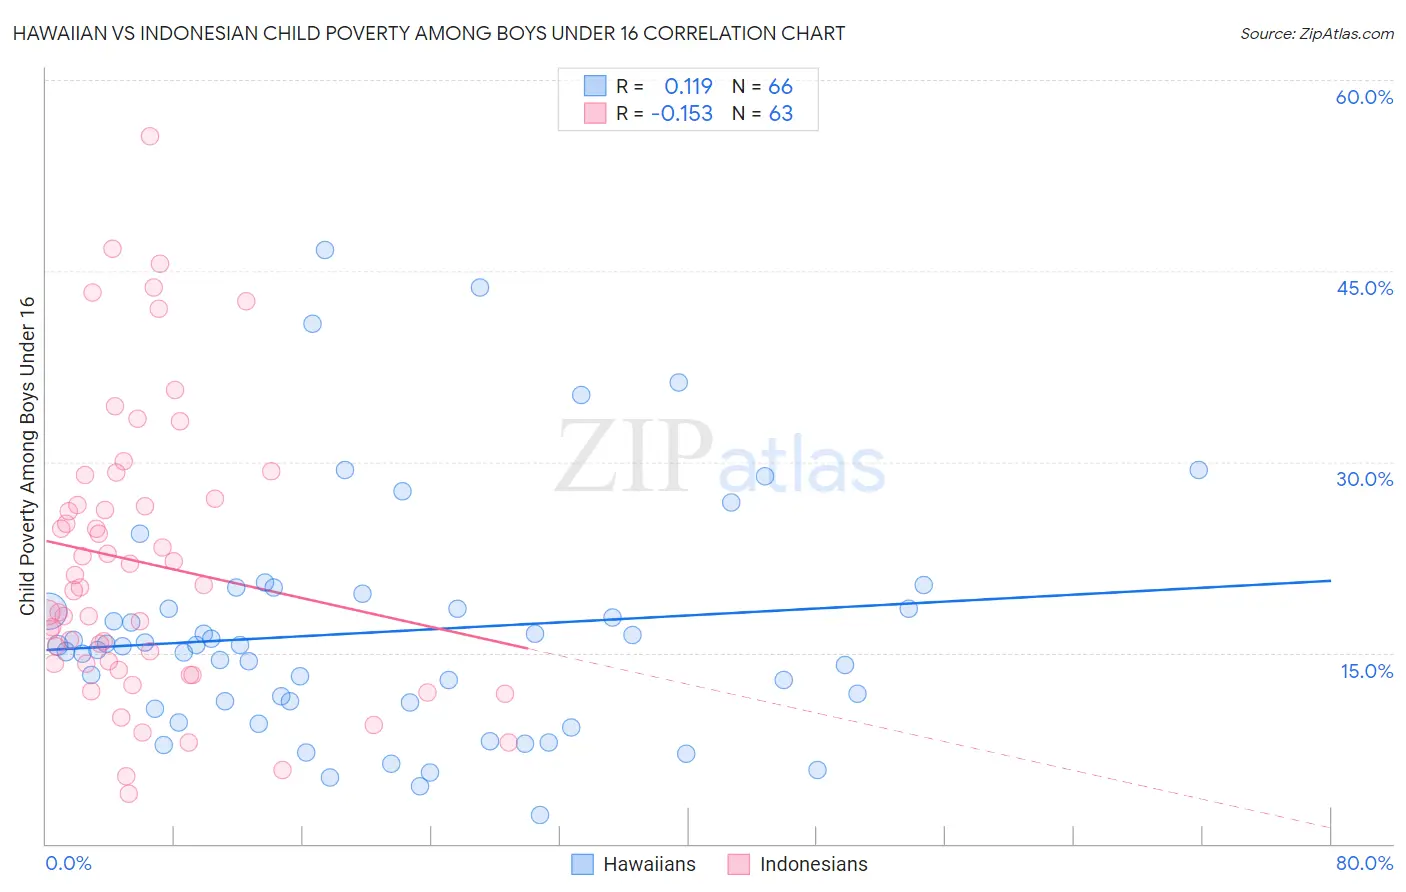
Hawaiian vs Indonesian Child Poverty Among Boys Under 16 Correlation Chart
The statistical analysis conducted on geographies consisting of 324,264,970 people shows a poor positive correlation between the proportion of Hawaiians and poverty level among boys under the age of 16 in the United States with a correlation coefficient (R) of 0.119 and weighted average of 16.5%. Similarly, the statistical analysis conducted on geographies consisting of 161,767,910 people shows a poor negative correlation between the proportion of Indonesians and poverty level among boys under the age of 16 in the United States with a correlation coefficient (R) of -0.153 and weighted average of 20.8%, a difference of 25.9%.
Child Poverty Among Boys Under 16 Correlation Summary
| Measurement | Hawaiian | Indonesian |
| Minimum | 2.3% | 3.9% |
| Maximum | 46.7% | 55.6% |
| Range | 44.4% | 51.7% |
| Mean | 16.6% | 22.1% |
| Median | 15.6% | 20.1% |
| Interquartile 25% (IQ1) | 11.1% | 14.1% |
| Interquartile 75% (IQ3) | 18.5% | 27.1% |
| Interquartile Range (IQR) | 7.4% | 13.0% |
| Standard Deviation (Sample) | 9.2% | 11.3% |
| Standard Deviation (Population) | 9.1% | 11.2% |
Similar Demographics by Child Poverty Among Boys Under 16
Demographics Similar to Hawaiians by Child Poverty Among Boys Under 16
In terms of child poverty among boys under 16, the demographic groups most similar to Hawaiians are South American Indian (16.5%, a difference of 0.14%), Hungarian (16.5%, a difference of 0.20%), Scotch-Irish (16.5%, a difference of 0.22%), Lebanese (16.6%, a difference of 0.25%), and Ethiopian (16.5%, a difference of 0.26%).
| Demographics | Rating | Rank | Child Poverty Among Boys Under 16 |
| Tsimshian | 50.5 /100 | #173 | Average 16.4% |
| Uruguayans | 50.0 /100 | #174 | Average 16.4% |
| Immigrants | Syria | 49.0 /100 | #175 | Average 16.5% |
| Whites/Caucasians | 48.2 /100 | #176 | Average 16.5% |
| Ethiopians | 47.8 /100 | #177 | Average 16.5% |
| Scotch-Irish | 47.5 /100 | #178 | Average 16.5% |
| Hungarians | 47.3 /100 | #179 | Average 16.5% |
| Hawaiians | 45.5 /100 | #180 | Average 16.5% |
| South American Indians | 44.3 /100 | #181 | Average 16.5% |
| Lebanese | 43.3 /100 | #182 | Average 16.6% |
| Kenyans | 41.0 /100 | #183 | Average 16.6% |
| Celtics | 40.6 /100 | #184 | Average 16.6% |
| Immigrants | Western Asia | 40.4 /100 | #185 | Average 16.6% |
| Hmong | 38.4 /100 | #186 | Fair 16.6% |
| Immigrants | Costa Rica | 37.8 /100 | #187 | Fair 16.7% |
Demographics Similar to Indonesians by Child Poverty Among Boys Under 16
In terms of child poverty among boys under 16, the demographic groups most similar to Indonesians are Mexican (20.7%, a difference of 0.20%), Immigrants from Bahamas (20.7%, a difference of 0.32%), Immigrants from Senegal (20.7%, a difference of 0.44%), Yaqui (20.7%, a difference of 0.45%), and Hispanic or Latino (20.9%, a difference of 0.61%).
| Demographics | Rating | Rank | Child Poverty Among Boys Under 16 |
| Blackfeet | 0.0 /100 | #289 | Tragic 20.4% |
| Senegalese | 0.0 /100 | #290 | Tragic 20.6% |
| Immigrants | Latin America | 0.0 /100 | #291 | Tragic 20.6% |
| Yaqui | 0.0 /100 | #292 | Tragic 20.7% |
| Immigrants | Senegal | 0.0 /100 | #293 | Tragic 20.7% |
| Immigrants | Bahamas | 0.0 /100 | #294 | Tragic 20.7% |
| Mexicans | 0.0 /100 | #295 | Tragic 20.7% |
| Indonesians | 0.0 /100 | #296 | Tragic 20.8% |
| Hispanics or Latinos | 0.0 /100 | #297 | Tragic 20.9% |
| Chippewa | 0.0 /100 | #298 | Tragic 21.0% |
| Immigrants | Caribbean | 0.0 /100 | #299 | Tragic 21.0% |
| Haitians | 0.0 /100 | #300 | Tragic 21.0% |
| Guatemalans | 0.0 /100 | #301 | Tragic 21.1% |
| Somalis | 0.0 /100 | #302 | Tragic 21.1% |
| Immigrants | Haiti | 0.0 /100 | #303 | Tragic 21.3% |