Scotch-Irish vs Immigrants from Western Africa Child Poverty Among Boys Under 16
COMPARE
Scotch-Irish
Immigrants from Western Africa
Child Poverty Among Boys Under 16
Child Poverty Among Boys Under 16 Comparison
Scotch-Irish
Immigrants from Western Africa
16.5%
CHILD POVERTY AMONG BOYS UNDER 16
47.5/ 100
METRIC RATING
178th/ 347
METRIC RANK
19.3%
CHILD POVERTY AMONG BOYS UNDER 16
0.2/ 100
METRIC RATING
252nd/ 347
METRIC RANK
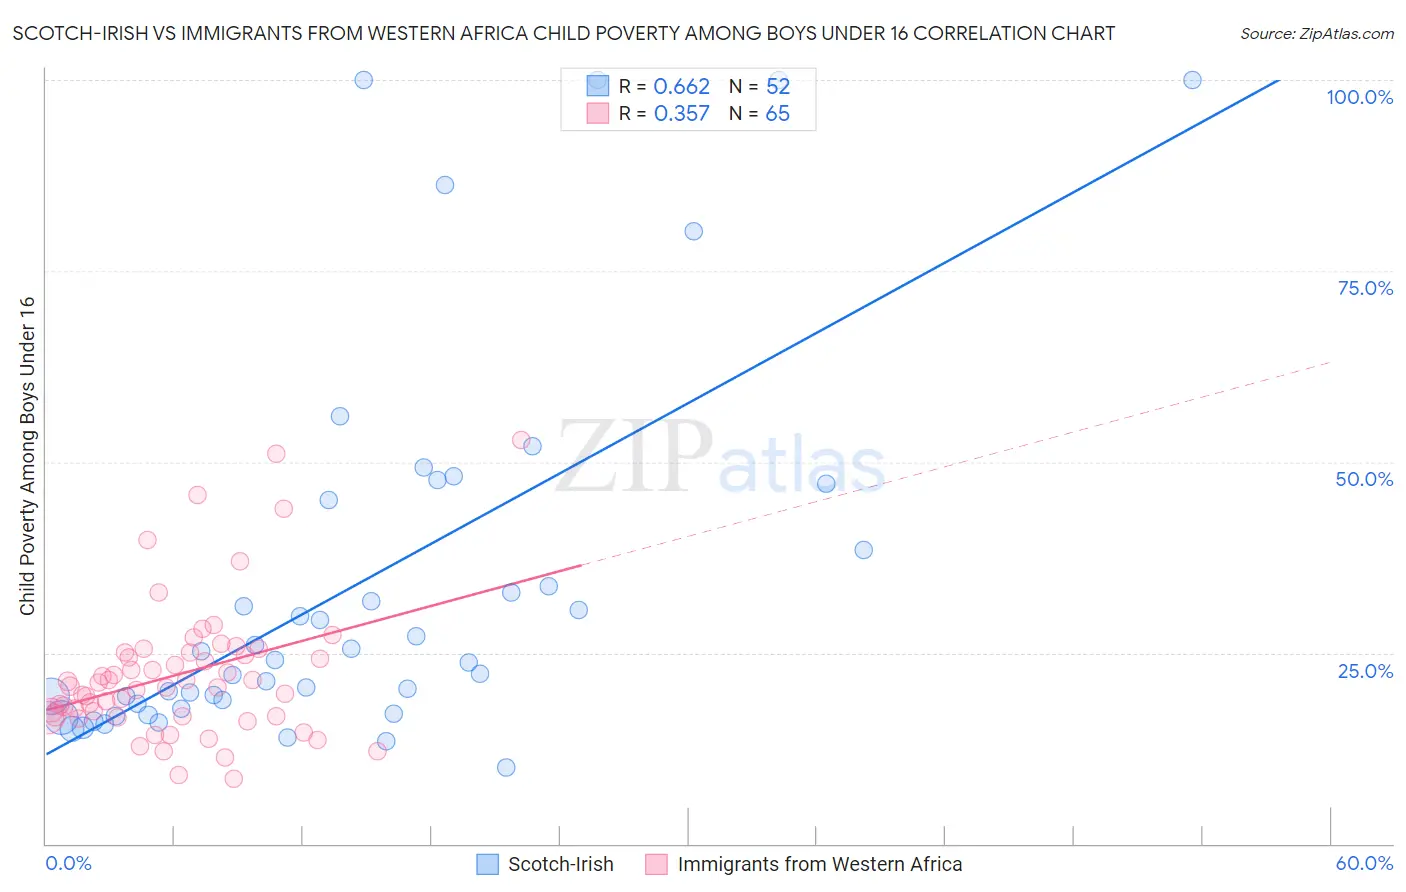
Scotch-Irish vs Immigrants from Western Africa Child Poverty Among Boys Under 16 Correlation Chart
The statistical analysis conducted on geographies consisting of 530,822,758 people shows a significant positive correlation between the proportion of Scotch-Irish and poverty level among boys under the age of 16 in the United States with a correlation coefficient (R) of 0.662 and weighted average of 16.5%. Similarly, the statistical analysis conducted on geographies consisting of 353,712,129 people shows a mild positive correlation between the proportion of Immigrants from Western Africa and poverty level among boys under the age of 16 in the United States with a correlation coefficient (R) of 0.357 and weighted average of 19.3%, a difference of 16.9%.
Child Poverty Among Boys Under 16 Correlation Summary
| Measurement | Scotch-Irish | Immigrants from Western Africa |
| Minimum | 10.0% | 8.5% |
| Maximum | 100.0% | 52.8% |
| Range | 90.0% | 44.4% |
| Mean | 33.9% | 22.2% |
| Median | 23.9% | 20.7% |
| Interquartile 25% (IQ1) | 18.0% | 16.6% |
| Interquartile 75% (IQ3) | 41.8% | 25.0% |
| Interquartile Range (IQR) | 23.8% | 8.4% |
| Standard Deviation (Sample) | 24.8% | 9.0% |
| Standard Deviation (Population) | 24.6% | 8.9% |
Similar Demographics by Child Poverty Among Boys Under 16
Demographics Similar to Scotch-Irish by Child Poverty Among Boys Under 16
In terms of child poverty among boys under 16, the demographic groups most similar to Scotch-Irish are Hungarian (16.5%, a difference of 0.020%), Ethiopian (16.5%, a difference of 0.040%), White/Caucasian (16.5%, a difference of 0.080%), Immigrants from Syria (16.5%, a difference of 0.17%), and Hawaiian (16.5%, a difference of 0.22%).
| Demographics | Rating | Rank | Child Poverty Among Boys Under 16 |
| Immigrants | Ethiopia | 51.3 /100 | #171 | Average 16.4% |
| Immigrants | Colombia | 50.8 /100 | #172 | Average 16.4% |
| Tsimshian | 50.5 /100 | #173 | Average 16.4% |
| Uruguayans | 50.0 /100 | #174 | Average 16.4% |
| Immigrants | Syria | 49.0 /100 | #175 | Average 16.5% |
| Whites/Caucasians | 48.2 /100 | #176 | Average 16.5% |
| Ethiopians | 47.8 /100 | #177 | Average 16.5% |
| Scotch-Irish | 47.5 /100 | #178 | Average 16.5% |
| Hungarians | 47.3 /100 | #179 | Average 16.5% |
| Hawaiians | 45.5 /100 | #180 | Average 16.5% |
| South American Indians | 44.3 /100 | #181 | Average 16.5% |
| Lebanese | 43.3 /100 | #182 | Average 16.6% |
| Kenyans | 41.0 /100 | #183 | Average 16.6% |
| Celtics | 40.6 /100 | #184 | Average 16.6% |
| Immigrants | Western Asia | 40.4 /100 | #185 | Average 16.6% |
Demographics Similar to Immigrants from Western Africa by Child Poverty Among Boys Under 16
In terms of child poverty among boys under 16, the demographic groups most similar to Immigrants from Western Africa are Liberian (19.3%, a difference of 0.070%), French American Indian (19.2%, a difference of 0.23%), Immigrants from Burma/Myanmar (19.2%, a difference of 0.26%), Trinidadian and Tobagonian (19.3%, a difference of 0.34%), and Ecuadorian (19.3%, a difference of 0.34%).
| Demographics | Rating | Rank | Child Poverty Among Boys Under 16 |
| Cree | 0.4 /100 | #245 | Tragic 19.0% |
| Immigrants | Nicaragua | 0.4 /100 | #246 | Tragic 19.0% |
| Immigrants | Trinidad and Tobago | 0.3 /100 | #247 | Tragic 19.0% |
| Salvadorans | 0.3 /100 | #248 | Tragic 19.0% |
| Alsatians | 0.3 /100 | #249 | Tragic 19.1% |
| Immigrants | Burma/Myanmar | 0.2 /100 | #250 | Tragic 19.2% |
| French American Indians | 0.2 /100 | #251 | Tragic 19.2% |
| Immigrants | Western Africa | 0.2 /100 | #252 | Tragic 19.3% |
| Liberians | 0.2 /100 | #253 | Tragic 19.3% |
| Trinidadians and Tobagonians | 0.2 /100 | #254 | Tragic 19.3% |
| Ecuadorians | 0.2 /100 | #255 | Tragic 19.3% |
| Immigrants | Liberia | 0.2 /100 | #256 | Tragic 19.3% |
| Mexican American Indians | 0.2 /100 | #257 | Tragic 19.4% |
| Potawatomi | 0.2 /100 | #258 | Tragic 19.4% |
| Spanish Americans | 0.2 /100 | #259 | Tragic 19.4% |