Immigrants from Netherlands vs Indonesian Child Poverty Among Boys Under 16
COMPARE
Immigrants from Netherlands
Indonesian
Child Poverty Among Boys Under 16
Child Poverty Among Boys Under 16 Comparison
Immigrants from Netherlands
Indonesians
14.6%
CHILD POVERTY AMONG BOYS UNDER 16
98.1/ 100
METRIC RATING
71st/ 347
METRIC RANK
20.8%
CHILD POVERTY AMONG BOYS UNDER 16
0.0/ 100
METRIC RATING
296th/ 347
METRIC RANK
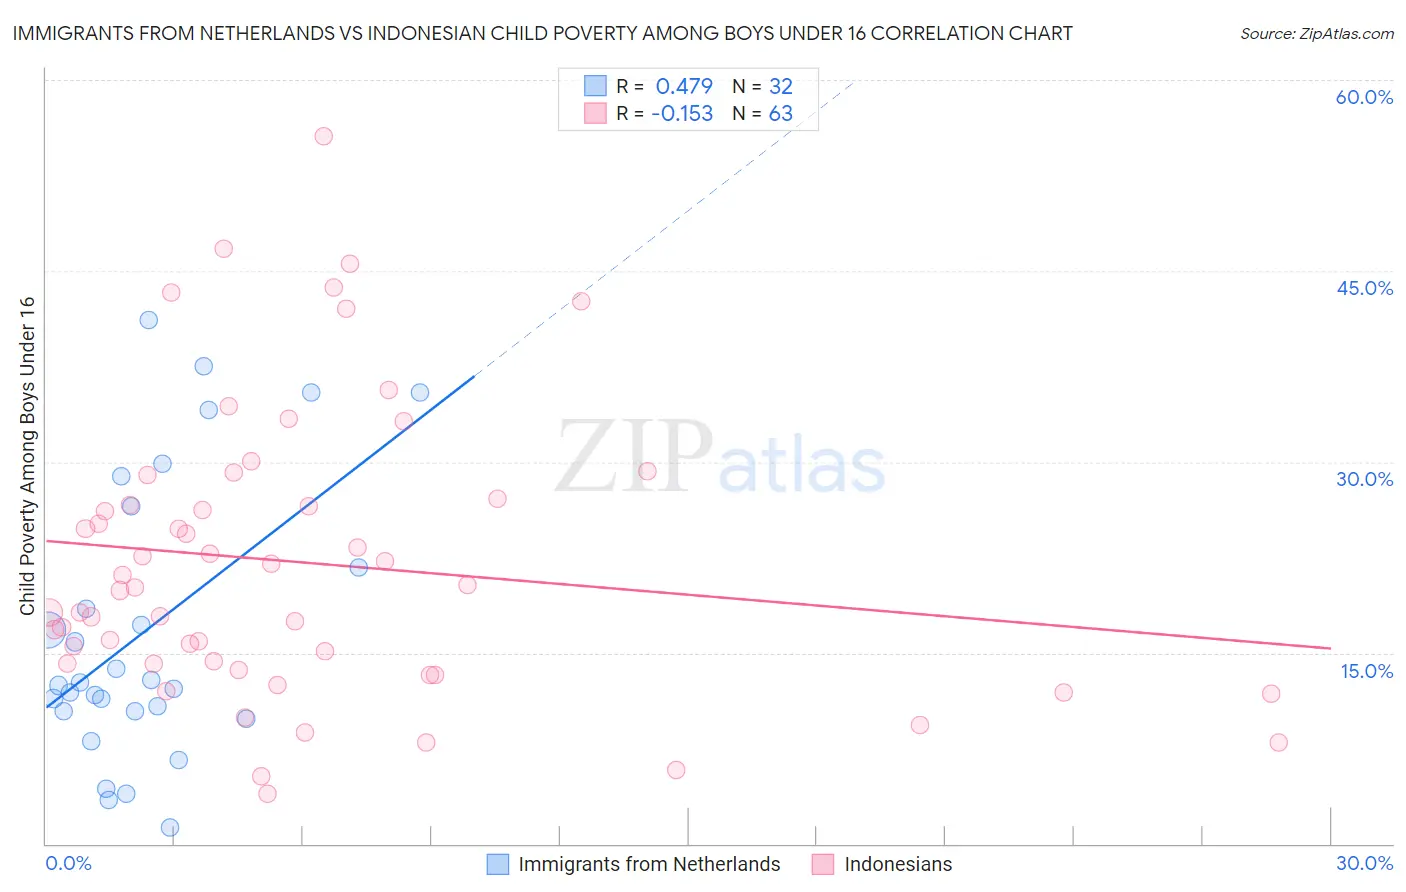
Immigrants from Netherlands vs Indonesian Child Poverty Among Boys Under 16 Correlation Chart
The statistical analysis conducted on geographies consisting of 234,687,495 people shows a moderate positive correlation between the proportion of Immigrants from Netherlands and poverty level among boys under the age of 16 in the United States with a correlation coefficient (R) of 0.479 and weighted average of 14.6%. Similarly, the statistical analysis conducted on geographies consisting of 161,767,910 people shows a poor negative correlation between the proportion of Indonesians and poverty level among boys under the age of 16 in the United States with a correlation coefficient (R) of -0.153 and weighted average of 20.8%, a difference of 42.0%.
Child Poverty Among Boys Under 16 Correlation Summary
| Measurement | Immigrants from Netherlands | Indonesian |
| Minimum | 1.3% | 3.9% |
| Maximum | 41.1% | 55.6% |
| Range | 39.9% | 51.7% |
| Mean | 16.8% | 22.1% |
| Median | 12.5% | 20.1% |
| Interquartile 25% (IQ1) | 10.4% | 14.1% |
| Interquartile 75% (IQ3) | 24.1% | 27.1% |
| Interquartile Range (IQR) | 13.7% | 13.0% |
| Standard Deviation (Sample) | 11.0% | 11.3% |
| Standard Deviation (Population) | 10.8% | 11.2% |
Similar Demographics by Child Poverty Among Boys Under 16
Demographics Similar to Immigrants from Netherlands by Child Poverty Among Boys Under 16
In terms of child poverty among boys under 16, the demographic groups most similar to Immigrants from Netherlands are Immigrants from Latvia (14.6%, a difference of 0.010%), Immigrants from Turkey (14.6%, a difference of 0.060%), Australian (14.7%, a difference of 0.11%), Immigrants from Poland (14.7%, a difference of 0.18%), and Immigrants from Croatia (14.7%, a difference of 0.24%).
| Demographics | Rating | Rank | Child Poverty Among Boys Under 16 |
| Immigrants | Romania | 98.5 /100 | #64 | Exceptional 14.5% |
| Soviet Union | 98.5 /100 | #65 | Exceptional 14.5% |
| Immigrants | Bulgaria | 98.5 /100 | #66 | Exceptional 14.5% |
| Immigrants | Europe | 98.4 /100 | #67 | Exceptional 14.5% |
| Slovenes | 98.4 /100 | #68 | Exceptional 14.5% |
| Immigrants | Austria | 98.4 /100 | #69 | Exceptional 14.5% |
| Europeans | 98.4 /100 | #70 | Exceptional 14.5% |
| Immigrants | Netherlands | 98.1 /100 | #71 | Exceptional 14.6% |
| Immigrants | Latvia | 98.1 /100 | #72 | Exceptional 14.6% |
| Immigrants | Turkey | 98.0 /100 | #73 | Exceptional 14.6% |
| Australians | 98.0 /100 | #74 | Exceptional 14.7% |
| Immigrants | Poland | 97.9 /100 | #75 | Exceptional 14.7% |
| Immigrants | Croatia | 97.9 /100 | #76 | Exceptional 14.7% |
| Macedonians | 97.9 /100 | #77 | Exceptional 14.7% |
| Egyptians | 97.8 /100 | #78 | Exceptional 14.7% |
Demographics Similar to Indonesians by Child Poverty Among Boys Under 16
In terms of child poverty among boys under 16, the demographic groups most similar to Indonesians are Mexican (20.7%, a difference of 0.20%), Immigrants from Bahamas (20.7%, a difference of 0.32%), Immigrants from Senegal (20.7%, a difference of 0.44%), Yaqui (20.7%, a difference of 0.45%), and Hispanic or Latino (20.9%, a difference of 0.61%).
| Demographics | Rating | Rank | Child Poverty Among Boys Under 16 |
| Blackfeet | 0.0 /100 | #289 | Tragic 20.4% |
| Senegalese | 0.0 /100 | #290 | Tragic 20.6% |
| Immigrants | Latin America | 0.0 /100 | #291 | Tragic 20.6% |
| Yaqui | 0.0 /100 | #292 | Tragic 20.7% |
| Immigrants | Senegal | 0.0 /100 | #293 | Tragic 20.7% |
| Immigrants | Bahamas | 0.0 /100 | #294 | Tragic 20.7% |
| Mexicans | 0.0 /100 | #295 | Tragic 20.7% |
| Indonesians | 0.0 /100 | #296 | Tragic 20.8% |
| Hispanics or Latinos | 0.0 /100 | #297 | Tragic 20.9% |
| Chippewa | 0.0 /100 | #298 | Tragic 21.0% |
| Immigrants | Caribbean | 0.0 /100 | #299 | Tragic 21.0% |
| Haitians | 0.0 /100 | #300 | Tragic 21.0% |
| Guatemalans | 0.0 /100 | #301 | Tragic 21.1% |
| Somalis | 0.0 /100 | #302 | Tragic 21.1% |
| Immigrants | Haiti | 0.0 /100 | #303 | Tragic 21.3% |