Black/African American vs Indonesian Child Poverty Among Boys Under 16
COMPARE
Black/African American
Indonesian
Child Poverty Among Boys Under 16
Child Poverty Among Boys Under 16 Comparison
Blacks/African Americans
Indonesians
24.5%
CHILD POVERTY AMONG BOYS UNDER 16
0.0/ 100
METRIC RATING
334th/ 347
METRIC RANK
20.8%
CHILD POVERTY AMONG BOYS UNDER 16
0.0/ 100
METRIC RATING
296th/ 347
METRIC RANK
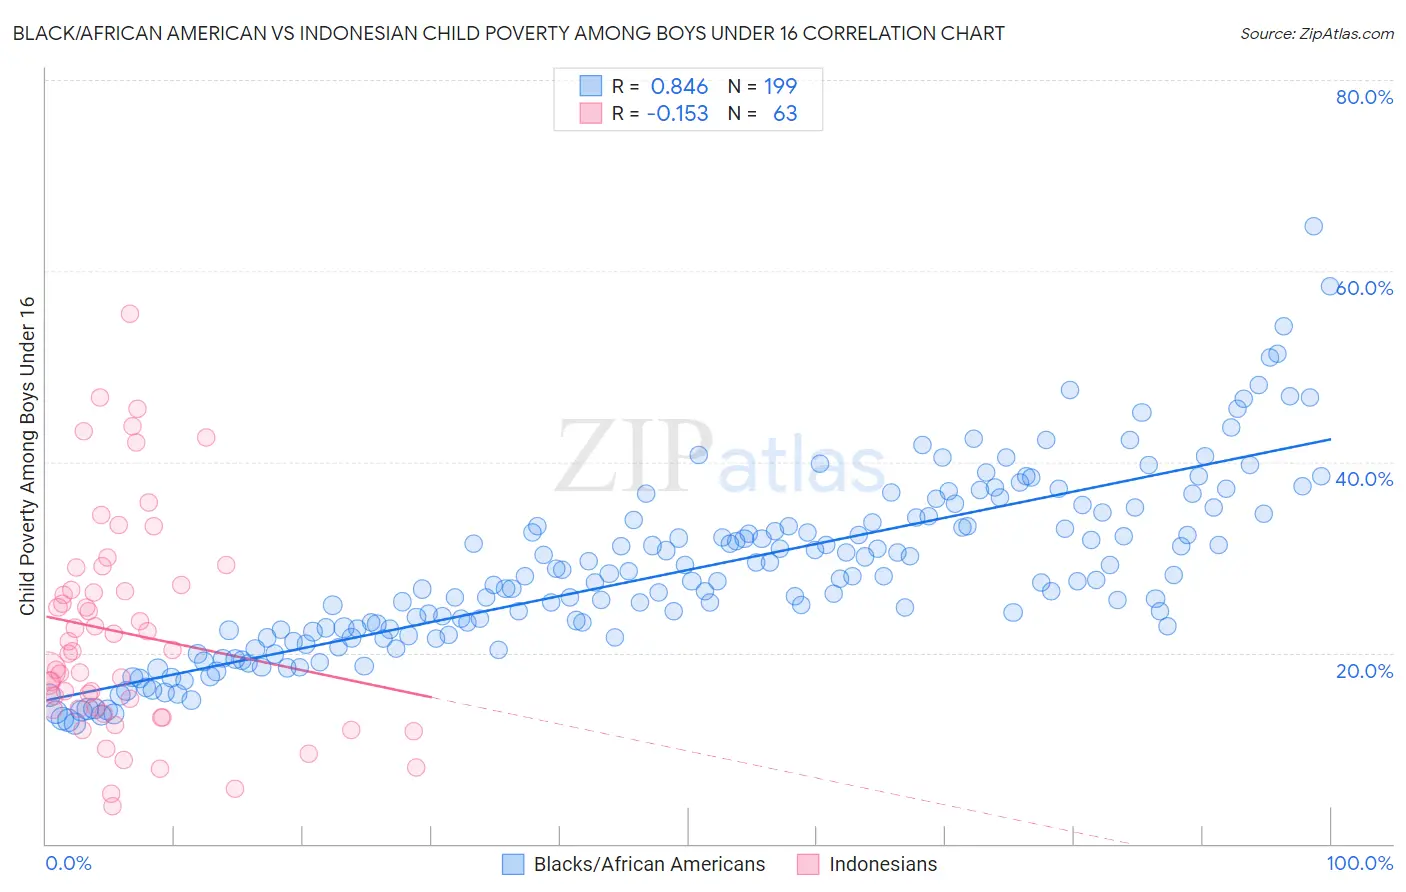
Black/African American vs Indonesian Child Poverty Among Boys Under 16 Correlation Chart
The statistical analysis conducted on geographies consisting of 548,051,875 people shows a very strong positive correlation between the proportion of Blacks/African Americans and poverty level among boys under the age of 16 in the United States with a correlation coefficient (R) of 0.846 and weighted average of 24.5%. Similarly, the statistical analysis conducted on geographies consisting of 161,767,910 people shows a poor negative correlation between the proportion of Indonesians and poverty level among boys under the age of 16 in the United States with a correlation coefficient (R) of -0.153 and weighted average of 20.8%, a difference of 18.0%.
Child Poverty Among Boys Under 16 Correlation Summary
| Measurement | Black/African American | Indonesian |
| Minimum | 12.5% | 3.9% |
| Maximum | 64.6% | 55.6% |
| Range | 52.1% | 51.7% |
| Mean | 28.6% | 22.1% |
| Median | 27.6% | 20.1% |
| Interquartile 25% (IQ1) | 21.9% | 14.1% |
| Interquartile 75% (IQ3) | 34.0% | 27.1% |
| Interquartile Range (IQR) | 12.1% | 13.0% |
| Standard Deviation (Sample) | 9.3% | 11.3% |
| Standard Deviation (Population) | 9.3% | 11.2% |
Similar Demographics by Child Poverty Among Boys Under 16
Demographics Similar to Blacks/African Americans by Child Poverty Among Boys Under 16
In terms of child poverty among boys under 16, the demographic groups most similar to Blacks/African Americans are Apache (24.5%, a difference of 0.12%), Immigrants from Dominican Republic (24.3%, a difference of 0.84%), Yup'ik (24.7%, a difference of 0.85%), Dominican (24.2%, a difference of 1.4%), and Colville (24.1%, a difference of 1.8%).
| Demographics | Rating | Rank | Child Poverty Among Boys Under 16 |
| Immigrants | Honduras | 0.0 /100 | #327 | Tragic 22.8% |
| Pueblo | 0.0 /100 | #328 | Tragic 23.5% |
| Natives/Alaskans | 0.0 /100 | #329 | Tragic 24.0% |
| Colville | 0.0 /100 | #330 | Tragic 24.1% |
| Dominicans | 0.0 /100 | #331 | Tragic 24.2% |
| Immigrants | Dominican Republic | 0.0 /100 | #332 | Tragic 24.3% |
| Apache | 0.0 /100 | #333 | Tragic 24.5% |
| Blacks/African Americans | 0.0 /100 | #334 | Tragic 24.5% |
| Yup'ik | 0.0 /100 | #335 | Tragic 24.7% |
| Sioux | 0.0 /100 | #336 | Tragic 25.3% |
| Cheyenne | 0.0 /100 | #337 | Tragic 25.8% |
| Hopi | 0.0 /100 | #338 | Tragic 25.9% |
| Houma | 0.0 /100 | #339 | Tragic 26.2% |
| Crow | 0.0 /100 | #340 | Tragic 26.3% |
| Immigrants | Yemen | 0.0 /100 | #341 | Tragic 28.9% |
Demographics Similar to Indonesians by Child Poverty Among Boys Under 16
In terms of child poverty among boys under 16, the demographic groups most similar to Indonesians are Mexican (20.7%, a difference of 0.20%), Immigrants from Bahamas (20.7%, a difference of 0.32%), Immigrants from Senegal (20.7%, a difference of 0.44%), Yaqui (20.7%, a difference of 0.45%), and Hispanic or Latino (20.9%, a difference of 0.61%).
| Demographics | Rating | Rank | Child Poverty Among Boys Under 16 |
| Blackfeet | 0.0 /100 | #289 | Tragic 20.4% |
| Senegalese | 0.0 /100 | #290 | Tragic 20.6% |
| Immigrants | Latin America | 0.0 /100 | #291 | Tragic 20.6% |
| Yaqui | 0.0 /100 | #292 | Tragic 20.7% |
| Immigrants | Senegal | 0.0 /100 | #293 | Tragic 20.7% |
| Immigrants | Bahamas | 0.0 /100 | #294 | Tragic 20.7% |
| Mexicans | 0.0 /100 | #295 | Tragic 20.7% |
| Indonesians | 0.0 /100 | #296 | Tragic 20.8% |
| Hispanics or Latinos | 0.0 /100 | #297 | Tragic 20.9% |
| Chippewa | 0.0 /100 | #298 | Tragic 21.0% |
| Immigrants | Caribbean | 0.0 /100 | #299 | Tragic 21.0% |
| Haitians | 0.0 /100 | #300 | Tragic 21.0% |
| Guatemalans | 0.0 /100 | #301 | Tragic 21.1% |
| Somalis | 0.0 /100 | #302 | Tragic 21.1% |
| Immigrants | Haiti | 0.0 /100 | #303 | Tragic 21.3% |