Croatian vs Indonesian Child Poverty Among Boys Under 16
COMPARE
Croatian
Indonesian
Child Poverty Among Boys Under 16
Child Poverty Among Boys Under 16 Comparison
Croatians
Indonesians
14.0%
CHILD POVERTY AMONG BOYS UNDER 16
99.5/ 100
METRIC RATING
43rd/ 347
METRIC RANK
20.8%
CHILD POVERTY AMONG BOYS UNDER 16
0.0/ 100
METRIC RATING
296th/ 347
METRIC RANK
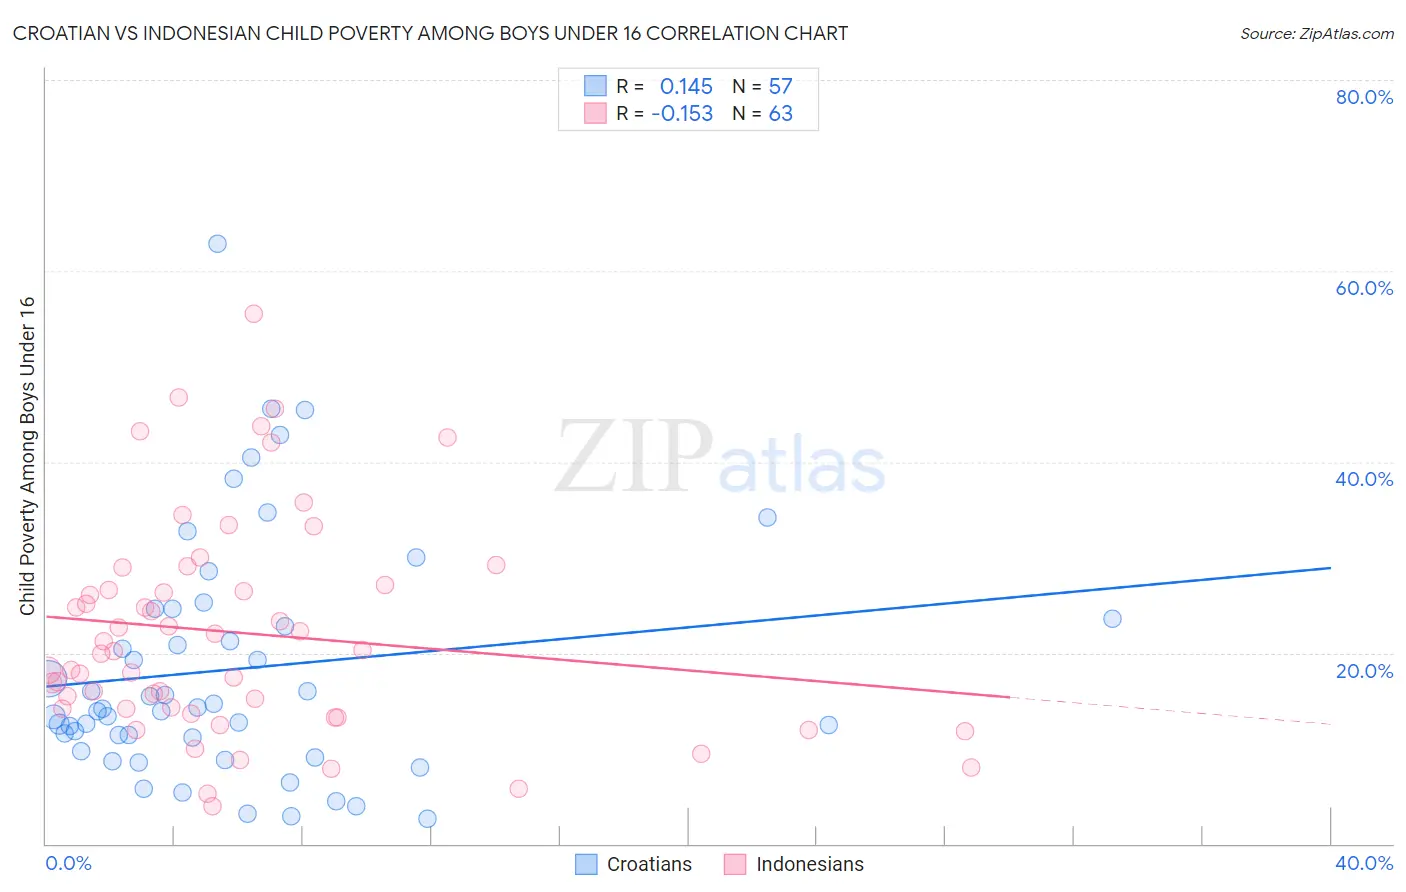
Croatian vs Indonesian Child Poverty Among Boys Under 16 Correlation Chart
The statistical analysis conducted on geographies consisting of 368,013,499 people shows a poor positive correlation between the proportion of Croatians and poverty level among boys under the age of 16 in the United States with a correlation coefficient (R) of 0.145 and weighted average of 14.0%. Similarly, the statistical analysis conducted on geographies consisting of 161,767,910 people shows a poor negative correlation between the proportion of Indonesians and poverty level among boys under the age of 16 in the United States with a correlation coefficient (R) of -0.153 and weighted average of 20.8%, a difference of 48.2%.
Child Poverty Among Boys Under 16 Correlation Summary
| Measurement | Croatian | Indonesian |
| Minimum | 2.6% | 3.9% |
| Maximum | 62.9% | 55.6% |
| Range | 60.3% | 51.7% |
| Mean | 18.3% | 22.1% |
| Median | 14.2% | 20.1% |
| Interquartile 25% (IQ1) | 10.4% | 14.1% |
| Interquartile 75% (IQ3) | 24.1% | 27.1% |
| Interquartile Range (IQR) | 13.7% | 13.0% |
| Standard Deviation (Sample) | 12.5% | 11.3% |
| Standard Deviation (Population) | 12.4% | 11.2% |
Similar Demographics by Child Poverty Among Boys Under 16
Demographics Similar to Croatians by Child Poverty Among Boys Under 16
In terms of child poverty among boys under 16, the demographic groups most similar to Croatians are Estonian (14.1%, a difference of 0.21%), Immigrants from Scotland (14.1%, a difference of 0.30%), Greek (14.1%, a difference of 0.41%), Korean (14.0%, a difference of 0.50%), and Lithuanian (14.0%, a difference of 0.53%).
| Demographics | Rating | Rank | Child Poverty Among Boys Under 16 |
| Luxembourgers | 99.7 /100 | #36 | Exceptional 13.8% |
| Immigrants | Sri Lanka | 99.6 /100 | #37 | Exceptional 13.9% |
| Immigrants | Northern Europe | 99.6 /100 | #38 | Exceptional 13.9% |
| Immigrants | Australia | 99.6 /100 | #39 | Exceptional 13.9% |
| Immigrants | Asia | 99.6 /100 | #40 | Exceptional 13.9% |
| Lithuanians | 99.6 /100 | #41 | Exceptional 14.0% |
| Koreans | 99.6 /100 | #42 | Exceptional 14.0% |
| Croatians | 99.5 /100 | #43 | Exceptional 14.0% |
| Estonians | 99.4 /100 | #44 | Exceptional 14.1% |
| Immigrants | Scotland | 99.4 /100 | #45 | Exceptional 14.1% |
| Greeks | 99.4 /100 | #46 | Exceptional 14.1% |
| Immigrants | Moldova | 99.4 /100 | #47 | Exceptional 14.1% |
| Immigrants | Indonesia | 99.4 /100 | #48 | Exceptional 14.1% |
| Czechs | 99.3 /100 | #49 | Exceptional 14.1% |
| Italians | 99.2 /100 | #50 | Exceptional 14.2% |
Demographics Similar to Indonesians by Child Poverty Among Boys Under 16
In terms of child poverty among boys under 16, the demographic groups most similar to Indonesians are Mexican (20.7%, a difference of 0.20%), Immigrants from Bahamas (20.7%, a difference of 0.32%), Immigrants from Senegal (20.7%, a difference of 0.44%), Yaqui (20.7%, a difference of 0.45%), and Hispanic or Latino (20.9%, a difference of 0.61%).
| Demographics | Rating | Rank | Child Poverty Among Boys Under 16 |
| Blackfeet | 0.0 /100 | #289 | Tragic 20.4% |
| Senegalese | 0.0 /100 | #290 | Tragic 20.6% |
| Immigrants | Latin America | 0.0 /100 | #291 | Tragic 20.6% |
| Yaqui | 0.0 /100 | #292 | Tragic 20.7% |
| Immigrants | Senegal | 0.0 /100 | #293 | Tragic 20.7% |
| Immigrants | Bahamas | 0.0 /100 | #294 | Tragic 20.7% |
| Mexicans | 0.0 /100 | #295 | Tragic 20.7% |
| Indonesians | 0.0 /100 | #296 | Tragic 20.8% |
| Hispanics or Latinos | 0.0 /100 | #297 | Tragic 20.9% |
| Chippewa | 0.0 /100 | #298 | Tragic 21.0% |
| Immigrants | Caribbean | 0.0 /100 | #299 | Tragic 21.0% |
| Haitians | 0.0 /100 | #300 | Tragic 21.0% |
| Guatemalans | 0.0 /100 | #301 | Tragic 21.1% |
| Somalis | 0.0 /100 | #302 | Tragic 21.1% |
| Immigrants | Haiti | 0.0 /100 | #303 | Tragic 21.3% |