Mongolian vs Immigrants from Micronesia Male Poverty
COMPARE
Mongolian
Immigrants from Micronesia
Male Poverty
Male Poverty Comparison
Mongolians
Immigrants from Micronesia
11.3%
MALE POVERTY
39.0/ 100
METRIC RATING
182nd/ 347
METRIC RANK
12.2%
MALE POVERTY
2.1/ 100
METRIC RATING
223rd/ 347
METRIC RANK
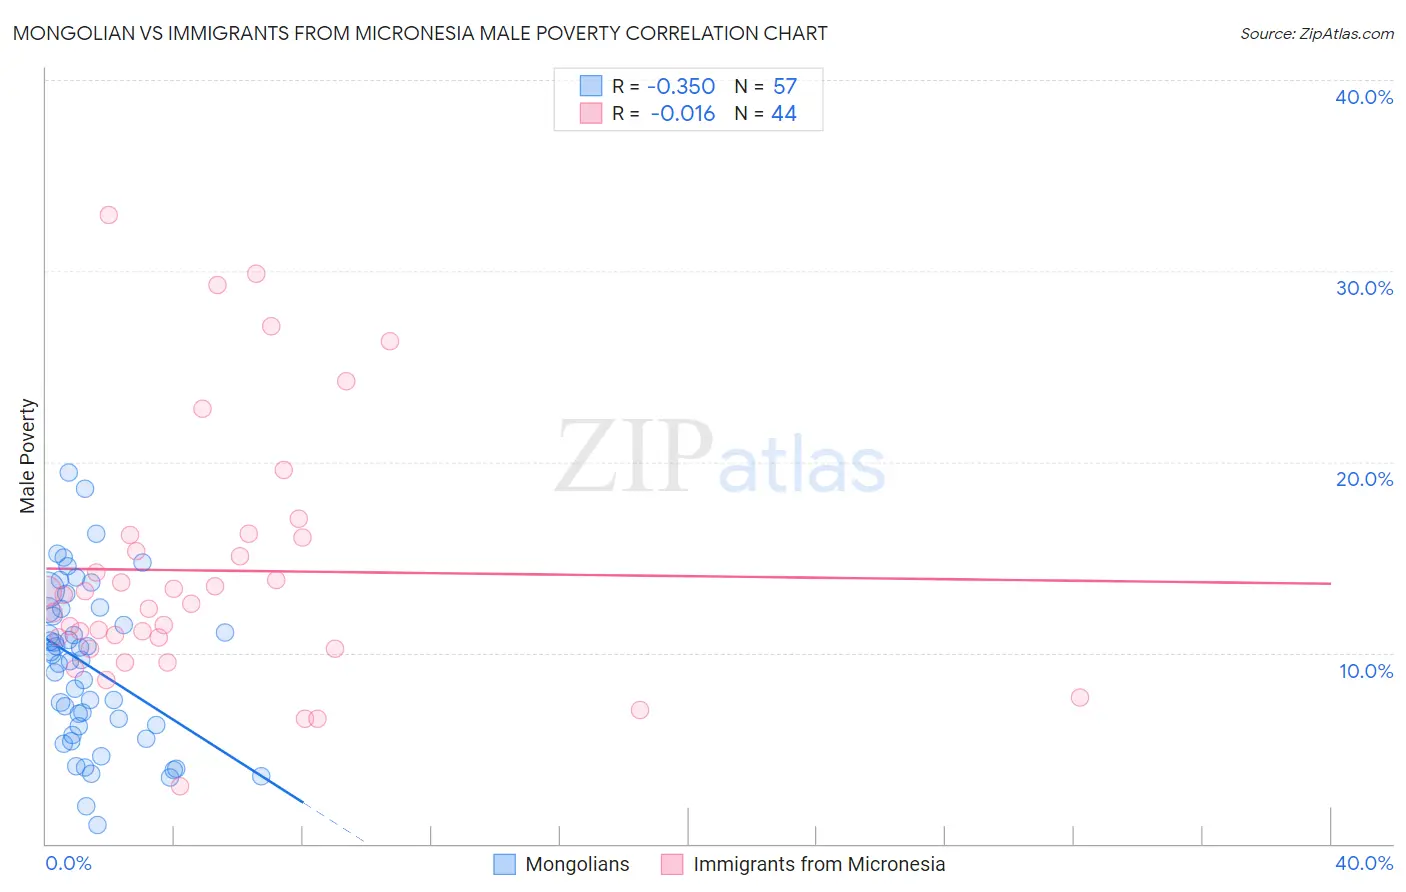
Mongolian vs Immigrants from Micronesia Male Poverty Correlation Chart
The statistical analysis conducted on geographies consisting of 140,285,777 people shows a mild negative correlation between the proportion of Mongolians and poverty level among males in the United States with a correlation coefficient (R) of -0.350 and weighted average of 11.3%. Similarly, the statistical analysis conducted on geographies consisting of 61,601,312 people shows no correlation between the proportion of Immigrants from Micronesia and poverty level among males in the United States with a correlation coefficient (R) of -0.016 and weighted average of 12.2%, a difference of 8.2%.
Male Poverty Correlation Summary
| Measurement | Mongolian | Immigrants from Micronesia |
| Minimum | 0.97% | 3.0% |
| Maximum | 19.4% | 32.9% |
| Range | 18.5% | 29.9% |
| Mean | 9.3% | 14.3% |
| Median | 9.6% | 12.8% |
| Interquartile 25% (IQ1) | 5.9% | 10.5% |
| Interquartile 75% (IQ3) | 12.3% | 16.1% |
| Interquartile Range (IQR) | 6.4% | 5.6% |
| Standard Deviation (Sample) | 4.2% | 6.7% |
| Standard Deviation (Population) | 4.2% | 6.6% |
Similar Demographics by Male Poverty
Demographics Similar to Mongolians by Male Poverty
In terms of male poverty, the demographic groups most similar to Mongolians are Immigrants from Costa Rica (11.3%, a difference of 0.050%), Kenyan (11.3%, a difference of 0.060%), Immigrants from Morocco (11.3%, a difference of 0.11%), Immigrants from Syria (11.3%, a difference of 0.13%), and Immigrants from South America (11.3%, a difference of 0.22%).
| Demographics | Rating | Rank | Male Poverty |
| Celtics | 47.5 /100 | #175 | Average 11.2% |
| Immigrants | Fiji | 46.0 /100 | #176 | Average 11.2% |
| Lebanese | 45.6 /100 | #177 | Average 11.2% |
| Immigrants | Cameroon | 44.5 /100 | #178 | Average 11.2% |
| Immigrants | Syria | 40.3 /100 | #179 | Average 11.3% |
| Immigrants | Morocco | 40.1 /100 | #180 | Average 11.3% |
| Immigrants | Costa Rica | 39.5 /100 | #181 | Fair 11.3% |
| Mongolians | 39.0 /100 | #182 | Fair 11.3% |
| Kenyans | 38.4 /100 | #183 | Fair 11.3% |
| Immigrants | South America | 36.9 /100 | #184 | Fair 11.3% |
| Immigrants | Afghanistan | 33.3 /100 | #185 | Fair 11.4% |
| Immigrants | Sierra Leone | 32.9 /100 | #186 | Fair 11.4% |
| Immigrants | Iraq | 31.9 /100 | #187 | Fair 11.4% |
| Sierra Leoneans | 29.9 /100 | #188 | Fair 11.4% |
| Hawaiians | 28.3 /100 | #189 | Fair 11.4% |
Demographics Similar to Immigrants from Micronesia by Male Poverty
In terms of male poverty, the demographic groups most similar to Immigrants from Micronesia are Immigrants from Africa (12.2%, a difference of 0.010%), Ugandan (12.2%, a difference of 0.040%), Immigrants from Eritrea (12.2%, a difference of 0.25%), Bermudan (12.2%, a difference of 0.26%), and German Russian (12.2%, a difference of 0.33%).
| Demographics | Rating | Rank | Male Poverty |
| Immigrants | Cambodia | 2.5 /100 | #216 | Tragic 12.2% |
| Immigrants | Thailand | 2.5 /100 | #217 | Tragic 12.2% |
| German Russians | 2.5 /100 | #218 | Tragic 12.2% |
| Bermudans | 2.4 /100 | #219 | Tragic 12.2% |
| Immigrants | Eritrea | 2.4 /100 | #220 | Tragic 12.2% |
| Ugandans | 2.2 /100 | #221 | Tragic 12.2% |
| Immigrants | Africa | 2.1 /100 | #222 | Tragic 12.2% |
| Immigrants | Micronesia | 2.1 /100 | #223 | Tragic 12.2% |
| Immigrants | Nigeria | 1.6 /100 | #224 | Tragic 12.3% |
| Osage | 1.5 /100 | #225 | Tragic 12.3% |
| Nigerians | 1.4 /100 | #226 | Tragic 12.3% |
| Alaska Natives | 1.4 /100 | #227 | Tragic 12.4% |
| Alsatians | 1.3 /100 | #228 | Tragic 12.4% |
| Cubans | 1.3 /100 | #229 | Tragic 12.4% |
| Marshallese | 0.8 /100 | #230 | Tragic 12.5% |