Hawaiian vs Immigrants from Micronesia Male Poverty
COMPARE
Hawaiian
Immigrants from Micronesia
Male Poverty
Male Poverty Comparison
Hawaiians
Immigrants from Micronesia
11.4%
MALE POVERTY
28.3/ 100
METRIC RATING
189th/ 347
METRIC RANK
12.2%
MALE POVERTY
2.1/ 100
METRIC RATING
223rd/ 347
METRIC RANK
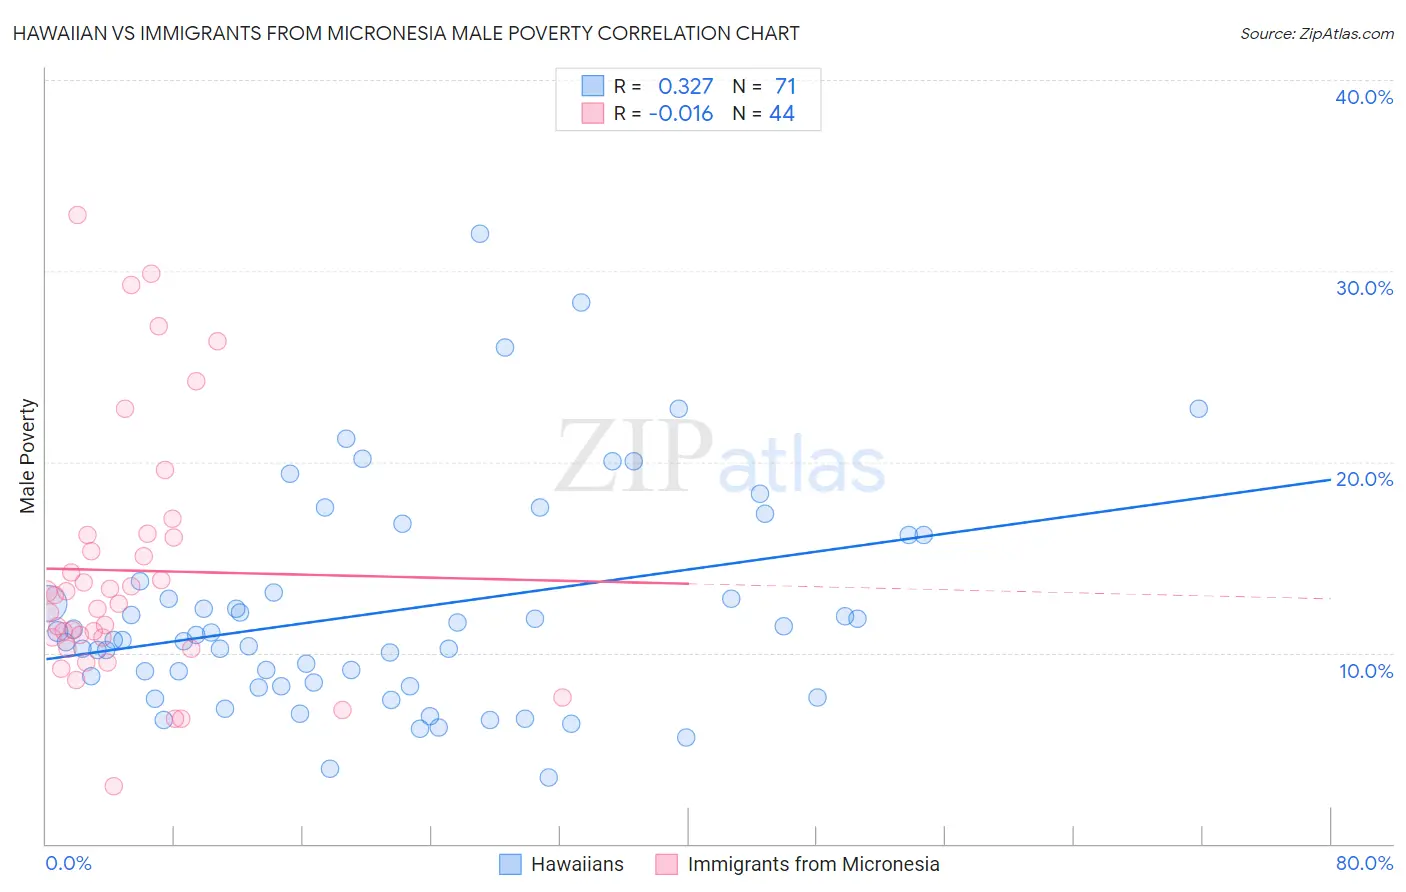
Hawaiian vs Immigrants from Micronesia Male Poverty Correlation Chart
The statistical analysis conducted on geographies consisting of 327,329,663 people shows a mild positive correlation between the proportion of Hawaiians and poverty level among males in the United States with a correlation coefficient (R) of 0.327 and weighted average of 11.4%. Similarly, the statistical analysis conducted on geographies consisting of 61,601,312 people shows no correlation between the proportion of Immigrants from Micronesia and poverty level among males in the United States with a correlation coefficient (R) of -0.016 and weighted average of 12.2%, a difference of 7.0%.
Male Poverty Correlation Summary
| Measurement | Hawaiian | Immigrants from Micronesia |
| Minimum | 3.5% | 3.0% |
| Maximum | 31.9% | 32.9% |
| Range | 28.5% | 29.9% |
| Mean | 12.2% | 14.3% |
| Median | 10.7% | 12.8% |
| Interquartile 25% (IQ1) | 8.3% | 10.5% |
| Interquartile 75% (IQ3) | 13.7% | 16.1% |
| Interquartile Range (IQR) | 5.4% | 5.6% |
| Standard Deviation (Sample) | 5.7% | 6.7% |
| Standard Deviation (Population) | 5.7% | 6.6% |
Similar Demographics by Male Poverty
Demographics Similar to Hawaiians by Male Poverty
In terms of male poverty, the demographic groups most similar to Hawaiians are Sierra Leonean (11.4%, a difference of 0.18%), Israeli (11.5%, a difference of 0.26%), Immigrants from Iraq (11.4%, a difference of 0.41%), Immigrants from Sierra Leone (11.4%, a difference of 0.52%), and Immigrants from Afghanistan (11.4%, a difference of 0.57%).
| Demographics | Rating | Rank | Male Poverty |
| Mongolians | 39.0 /100 | #182 | Fair 11.3% |
| Kenyans | 38.4 /100 | #183 | Fair 11.3% |
| Immigrants | South America | 36.9 /100 | #184 | Fair 11.3% |
| Immigrants | Afghanistan | 33.3 /100 | #185 | Fair 11.4% |
| Immigrants | Sierra Leone | 32.9 /100 | #186 | Fair 11.4% |
| Immigrants | Iraq | 31.9 /100 | #187 | Fair 11.4% |
| Sierra Leoneans | 29.9 /100 | #188 | Fair 11.4% |
| Hawaiians | 28.3 /100 | #189 | Fair 11.4% |
| Israelis | 26.1 /100 | #190 | Fair 11.5% |
| South American Indians | 22.8 /100 | #191 | Fair 11.5% |
| Immigrants | Uruguay | 19.1 /100 | #192 | Poor 11.6% |
| Immigrants | Kuwait | 17.3 /100 | #193 | Poor 11.6% |
| Immigrants | Kenya | 16.1 /100 | #194 | Poor 11.6% |
| Arabs | 15.8 /100 | #195 | Poor 11.6% |
| Hmong | 15.8 /100 | #196 | Poor 11.6% |
Demographics Similar to Immigrants from Micronesia by Male Poverty
In terms of male poverty, the demographic groups most similar to Immigrants from Micronesia are Immigrants from Africa (12.2%, a difference of 0.010%), Ugandan (12.2%, a difference of 0.040%), Immigrants from Eritrea (12.2%, a difference of 0.25%), Bermudan (12.2%, a difference of 0.26%), and German Russian (12.2%, a difference of 0.33%).
| Demographics | Rating | Rank | Male Poverty |
| Immigrants | Cambodia | 2.5 /100 | #216 | Tragic 12.2% |
| Immigrants | Thailand | 2.5 /100 | #217 | Tragic 12.2% |
| German Russians | 2.5 /100 | #218 | Tragic 12.2% |
| Bermudans | 2.4 /100 | #219 | Tragic 12.2% |
| Immigrants | Eritrea | 2.4 /100 | #220 | Tragic 12.2% |
| Ugandans | 2.2 /100 | #221 | Tragic 12.2% |
| Immigrants | Africa | 2.1 /100 | #222 | Tragic 12.2% |
| Immigrants | Micronesia | 2.1 /100 | #223 | Tragic 12.2% |
| Immigrants | Nigeria | 1.6 /100 | #224 | Tragic 12.3% |
| Osage | 1.5 /100 | #225 | Tragic 12.3% |
| Nigerians | 1.4 /100 | #226 | Tragic 12.3% |
| Alaska Natives | 1.4 /100 | #227 | Tragic 12.4% |
| Alsatians | 1.3 /100 | #228 | Tragic 12.4% |
| Cubans | 1.3 /100 | #229 | Tragic 12.4% |
| Marshallese | 0.8 /100 | #230 | Tragic 12.5% |