Macedonian vs Immigrants from Micronesia Male Poverty
COMPARE
Macedonian
Immigrants from Micronesia
Male Poverty
Male Poverty Comparison
Macedonians
Immigrants from Micronesia
9.7%
MALE POVERTY
99.5/ 100
METRIC RATING
32nd/ 347
METRIC RANK
12.2%
MALE POVERTY
2.1/ 100
METRIC RATING
223rd/ 347
METRIC RANK
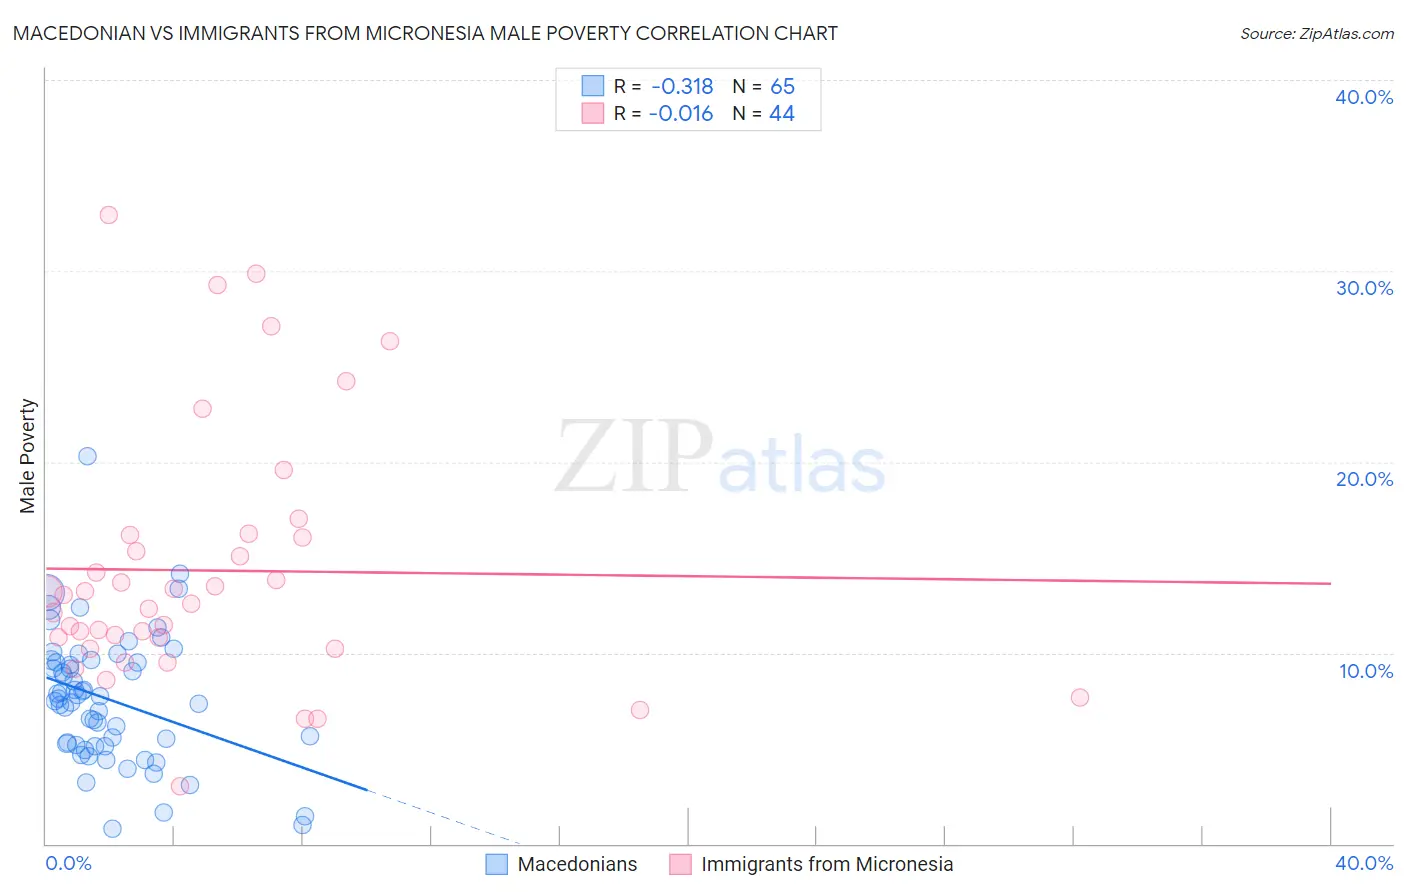
Macedonian vs Immigrants from Micronesia Male Poverty Correlation Chart
The statistical analysis conducted on geographies consisting of 132,583,851 people shows a mild negative correlation between the proportion of Macedonians and poverty level among males in the United States with a correlation coefficient (R) of -0.318 and weighted average of 9.7%. Similarly, the statistical analysis conducted on geographies consisting of 61,601,312 people shows no correlation between the proportion of Immigrants from Micronesia and poverty level among males in the United States with a correlation coefficient (R) of -0.016 and weighted average of 12.2%, a difference of 25.7%.
Male Poverty Correlation Summary
| Measurement | Macedonian | Immigrants from Micronesia |
| Minimum | 0.75% | 3.0% |
| Maximum | 20.3% | 32.9% |
| Range | 19.6% | 29.9% |
| Mean | 7.6% | 14.3% |
| Median | 7.6% | 12.8% |
| Interquartile 25% (IQ1) | 5.1% | 10.5% |
| Interquartile 75% (IQ3) | 9.5% | 16.1% |
| Interquartile Range (IQR) | 4.4% | 5.6% |
| Standard Deviation (Sample) | 3.4% | 6.7% |
| Standard Deviation (Population) | 3.4% | 6.6% |
Similar Demographics by Male Poverty
Demographics Similar to Macedonians by Male Poverty
In terms of male poverty, the demographic groups most similar to Macedonians are Immigrants from Northern Europe (9.7%, a difference of 0.090%), Tongan (9.7%, a difference of 0.21%), Polish (9.7%, a difference of 0.23%), Immigrants from Poland (9.8%, a difference of 0.23%), and Greek (9.7%, a difference of 0.30%).
| Demographics | Rating | Rank | Male Poverty |
| Eastern Europeans | 99.6 /100 | #25 | Exceptional 9.6% |
| Burmese | 99.6 /100 | #26 | Exceptional 9.7% |
| Danes | 99.6 /100 | #27 | Exceptional 9.7% |
| Immigrants | Korea | 99.6 /100 | #28 | Exceptional 9.7% |
| Greeks | 99.6 /100 | #29 | Exceptional 9.7% |
| Poles | 99.5 /100 | #30 | Exceptional 9.7% |
| Tongans | 99.5 /100 | #31 | Exceptional 9.7% |
| Macedonians | 99.5 /100 | #32 | Exceptional 9.7% |
| Immigrants | Northern Europe | 99.5 /100 | #33 | Exceptional 9.7% |
| Immigrants | Poland | 99.5 /100 | #34 | Exceptional 9.8% |
| Iranians | 99.4 /100 | #35 | Exceptional 9.8% |
| Czechs | 99.4 /100 | #36 | Exceptional 9.8% |
| Immigrants | Greece | 99.3 /100 | #37 | Exceptional 9.8% |
| Immigrants | Pakistan | 99.2 /100 | #38 | Exceptional 9.9% |
| Russians | 99.2 /100 | #39 | Exceptional 9.9% |
Demographics Similar to Immigrants from Micronesia by Male Poverty
In terms of male poverty, the demographic groups most similar to Immigrants from Micronesia are Immigrants from Africa (12.2%, a difference of 0.010%), Ugandan (12.2%, a difference of 0.040%), Immigrants from Eritrea (12.2%, a difference of 0.25%), Bermudan (12.2%, a difference of 0.26%), and German Russian (12.2%, a difference of 0.33%).
| Demographics | Rating | Rank | Male Poverty |
| Immigrants | Cambodia | 2.5 /100 | #216 | Tragic 12.2% |
| Immigrants | Thailand | 2.5 /100 | #217 | Tragic 12.2% |
| German Russians | 2.5 /100 | #218 | Tragic 12.2% |
| Bermudans | 2.4 /100 | #219 | Tragic 12.2% |
| Immigrants | Eritrea | 2.4 /100 | #220 | Tragic 12.2% |
| Ugandans | 2.2 /100 | #221 | Tragic 12.2% |
| Immigrants | Africa | 2.1 /100 | #222 | Tragic 12.2% |
| Immigrants | Micronesia | 2.1 /100 | #223 | Tragic 12.2% |
| Immigrants | Nigeria | 1.6 /100 | #224 | Tragic 12.3% |
| Osage | 1.5 /100 | #225 | Tragic 12.3% |
| Nigerians | 1.4 /100 | #226 | Tragic 12.3% |
| Alaska Natives | 1.4 /100 | #227 | Tragic 12.4% |
| Alsatians | 1.3 /100 | #228 | Tragic 12.4% |
| Cubans | 1.3 /100 | #229 | Tragic 12.4% |
| Marshallese | 0.8 /100 | #230 | Tragic 12.5% |