Scandinavian vs Yuman Median Household Income
COMPARE
Scandinavian
Yuman
Median Household Income
Median Household Income Comparison
Scandinavians
Yuman
$86,073
MEDIAN HOUSEHOLD INCOME
65.1/ 100
METRIC RATING
166th/ 347
METRIC RANK
$68,743
MEDIAN HOUSEHOLD INCOME
0.0/ 100
METRIC RATING
326th/ 347
METRIC RANK
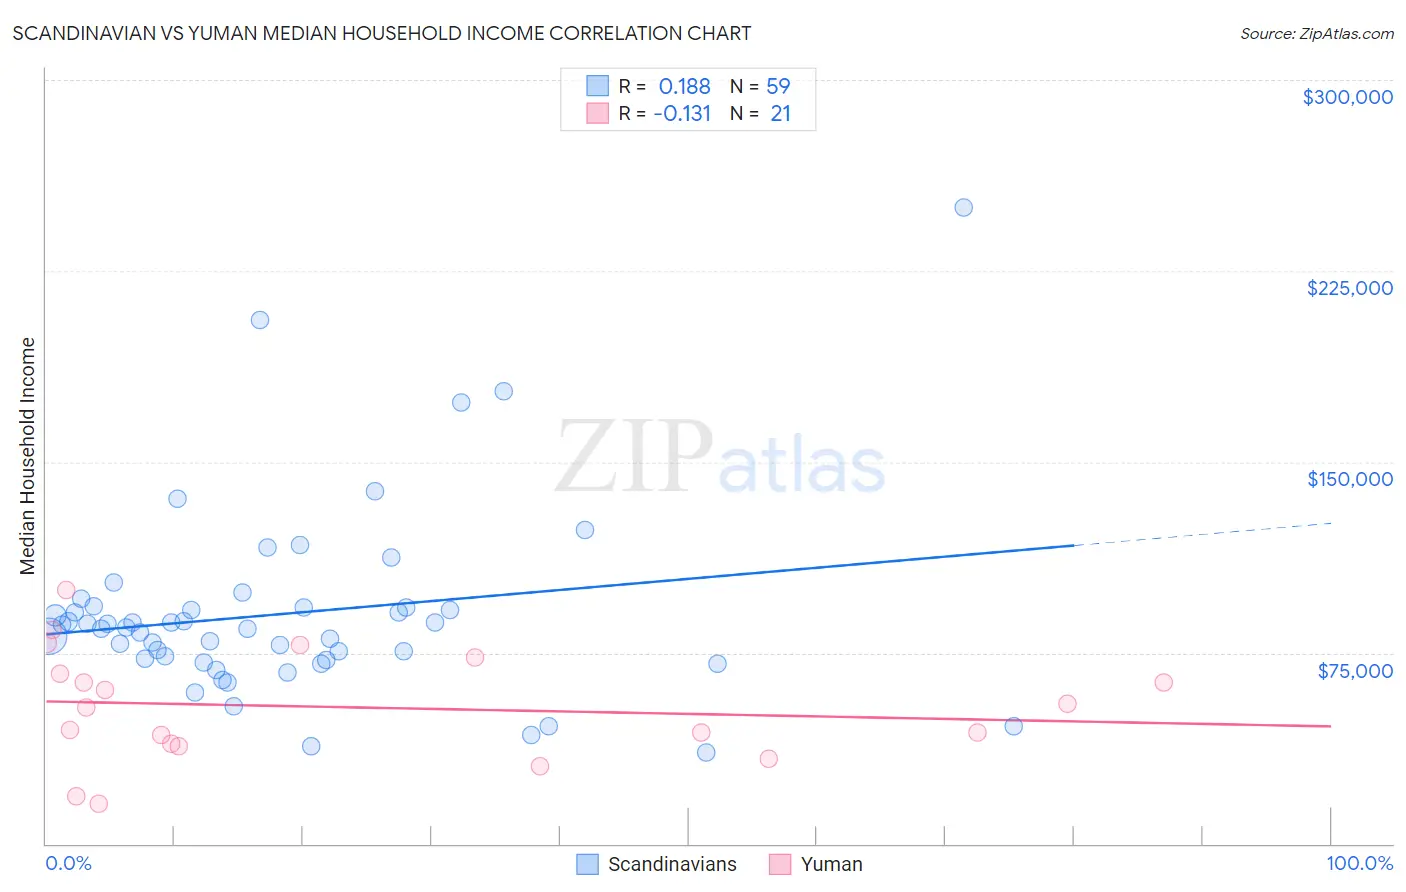
Scandinavian vs Yuman Median Household Income Correlation Chart
The statistical analysis conducted on geographies consisting of 472,110,165 people shows a poor positive correlation between the proportion of Scandinavians and median household income in the United States with a correlation coefficient (R) of 0.188 and weighted average of $86,073. Similarly, the statistical analysis conducted on geographies consisting of 40,662,869 people shows a poor negative correlation between the proportion of Yuman and median household income in the United States with a correlation coefficient (R) of -0.131 and weighted average of $68,743, a difference of 25.2%.
Median Household Income Correlation Summary
| Measurement | Scandinavian | Yuman |
| Minimum | $35,625 | $15,625 |
| Maximum | $250,001 | $99,695 |
| Range | $214,376 | $84,070 |
| Mean | $90,420 | $53,635 |
| Median | $84,951 | $53,295 |
| Interquartile 25% (IQ1) | $72,386 | $38,762 |
| Interquartile 75% (IQ3) | $92,885 | $69,936 |
| Interquartile Range (IQR) | $20,499 | $31,174 |
| Standard Deviation (Sample) | $37,436 | $21,822 |
| Standard Deviation (Population) | $37,118 | $21,296 |
Similar Demographics by Median Household Income
Demographics Similar to Scandinavians by Median Household Income
In terms of median household income, the demographic groups most similar to Scandinavians are Norwegian ($86,084, a difference of 0.010%), Irish ($86,145, a difference of 0.080%), Czech ($86,164, a difference of 0.11%), Guamanian/Chamorro ($86,255, a difference of 0.21%), and Immigrants ($85,818, a difference of 0.30%).
| Demographics | Rating | Rank | Median Household Income |
| Immigrants | Uzbekistan | 70.1 /100 | #159 | Good $86,425 |
| Luxembourgers | 70.0 /100 | #160 | Good $86,418 |
| Slavs | 69.7 /100 | #161 | Good $86,398 |
| Guamanians/Chamorros | 67.7 /100 | #162 | Good $86,255 |
| Czechs | 66.4 /100 | #163 | Good $86,164 |
| Irish | 66.2 /100 | #164 | Good $86,145 |
| Norwegians | 65.3 /100 | #165 | Good $86,084 |
| Scandinavians | 65.1 /100 | #166 | Good $86,073 |
| Immigrants | Immigrants | 61.3 /100 | #167 | Good $85,818 |
| Icelanders | 61.0 /100 | #168 | Good $85,797 |
| Colombians | 59.7 /100 | #169 | Average $85,716 |
| Swiss | 59.2 /100 | #170 | Average $85,681 |
| Immigrants | South America | 58.1 /100 | #171 | Average $85,611 |
| Slovenes | 57.4 /100 | #172 | Average $85,562 |
| Immigrants | Cameroon | 53.4 /100 | #173 | Average $85,314 |
Demographics Similar to Yuman by Median Household Income
In terms of median household income, the demographic groups most similar to Yuman are Immigrants from Cuba ($68,461, a difference of 0.41%), Menominee ($68,423, a difference of 0.47%), Dutch West Indian ($68,412, a difference of 0.48%), Seminole ($69,420, a difference of 0.98%), and Arapaho ($67,965, a difference of 1.1%).
| Demographics | Rating | Rank | Median Household Income |
| Immigrants | Dominican Republic | 0.0 /100 | #319 | Tragic $70,208 |
| Colville | 0.0 /100 | #320 | Tragic $70,094 |
| Chickasaw | 0.0 /100 | #321 | Tragic $70,005 |
| Choctaw | 0.0 /100 | #322 | Tragic $69,947 |
| Bahamians | 0.0 /100 | #323 | Tragic $69,726 |
| Yup'ik | 0.0 /100 | #324 | Tragic $69,695 |
| Seminole | 0.0 /100 | #325 | Tragic $69,420 |
| Yuman | 0.0 /100 | #326 | Tragic $68,743 |
| Immigrants | Cuba | 0.0 /100 | #327 | Tragic $68,461 |
| Menominee | 0.0 /100 | #328 | Tragic $68,423 |
| Dutch West Indians | 0.0 /100 | #329 | Tragic $68,412 |
| Arapaho | 0.0 /100 | #330 | Tragic $67,965 |
| Natives/Alaskans | 0.0 /100 | #331 | Tragic $67,879 |
| Sioux | 0.0 /100 | #332 | Tragic $67,792 |
| Creek | 0.0 /100 | #333 | Tragic $67,715 |