Scandinavian vs Immigrants from Nigeria Householder Income Ages 45 - 64 years
COMPARE
Scandinavian
Immigrants from Nigeria
Householder Income Ages 45 - 64 years
Householder Income Ages 45 - 64 years Comparison
Scandinavians
Immigrants from Nigeria
$102,969
HOUSEHOLDER INCOME AGES 45 - 64 YEARS
79.0/ 100
METRIC RATING
153rd/ 347
METRIC RANK
$94,804
HOUSEHOLDER INCOME AGES 45 - 64 YEARS
5.9/ 100
METRIC RATING
221st/ 347
METRIC RANK
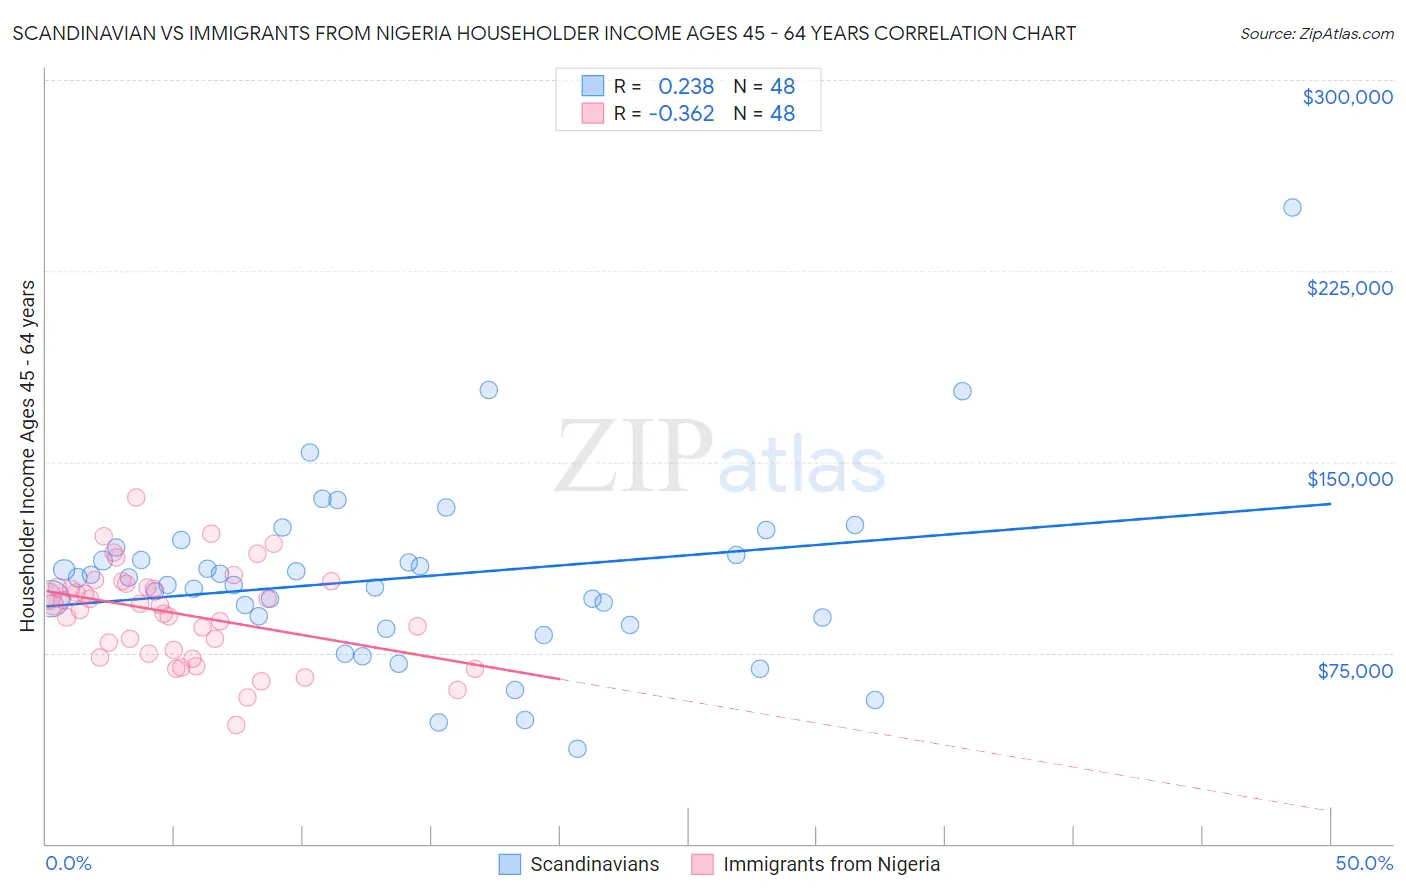
Scandinavian vs Immigrants from Nigeria Householder Income Ages 45 - 64 years Correlation Chart
The statistical analysis conducted on geographies consisting of 471,257,536 people shows a weak positive correlation between the proportion of Scandinavians and household income with householder between the ages 45 and 64 in the United States with a correlation coefficient (R) of 0.238 and weighted average of $102,969. Similarly, the statistical analysis conducted on geographies consisting of 283,069,423 people shows a mild negative correlation between the proportion of Immigrants from Nigeria and household income with householder between the ages 45 and 64 in the United States with a correlation coefficient (R) of -0.362 and weighted average of $94,804, a difference of 8.6%.
Householder Income Ages 45 - 64 years Correlation Summary
| Measurement | Scandinavian | Immigrants from Nigeria |
| Minimum | $37,396 | $46,429 |
| Maximum | $250,001 | $136,191 |
| Range | $212,605 | $89,762 |
| Mean | $104,566 | $90,499 |
| Median | $103,110 | $93,669 |
| Interquartile 25% (IQ1) | $87,340 | $75,303 |
| Interquartile 75% (IQ3) | $114,988 | $101,492 |
| Interquartile Range (IQR) | $27,648 | $26,189 |
| Standard Deviation (Sample) | $35,851 | $18,699 |
| Standard Deviation (Population) | $35,476 | $18,504 |
Similar Demographics by Householder Income Ages 45 - 64 years
Demographics Similar to Scandinavians by Householder Income Ages 45 - 64 years
In terms of householder income ages 45 - 64 years, the demographic groups most similar to Scandinavians are Slovene ($102,885, a difference of 0.080%), Irish ($103,067, a difference of 0.090%), Swiss ($103,071, a difference of 0.10%), Costa Rican ($102,779, a difference of 0.19%), and Carpatho Rusyn ($102,777, a difference of 0.19%).
| Demographics | Rating | Rank | Householder Income Ages 45 - 64 years |
| Immigrants | Chile | 82.5 /100 | #146 | Excellent $103,412 |
| Basques | 82.3 /100 | #147 | Excellent $103,387 |
| Immigrants | Germany | 81.5 /100 | #148 | Excellent $103,282 |
| Immigrants | Sierra Leone | 81.1 /100 | #149 | Excellent $103,227 |
| Immigrants | Peru | 80.7 /100 | #150 | Excellent $103,173 |
| Swiss | 79.9 /100 | #151 | Good $103,071 |
| Irish | 79.8 /100 | #152 | Good $103,067 |
| Scandinavians | 79.0 /100 | #153 | Good $102,969 |
| Slovenes | 78.3 /100 | #154 | Good $102,885 |
| Costa Ricans | 77.4 /100 | #155 | Good $102,779 |
| Carpatho Rusyns | 77.4 /100 | #156 | Good $102,777 |
| Immigrants | Ethiopia | 77.3 /100 | #157 | Good $102,763 |
| Slavs | 76.1 /100 | #158 | Good $102,629 |
| Sierra Leoneans | 74.2 /100 | #159 | Good $102,427 |
| Icelanders | 72.5 /100 | #160 | Good $102,261 |
Demographics Similar to Immigrants from Nigeria by Householder Income Ages 45 - 64 years
In terms of householder income ages 45 - 64 years, the demographic groups most similar to Immigrants from Nigeria are Salvadoran ($94,842, a difference of 0.040%), Immigrants from Armenia ($94,863, a difference of 0.060%), Delaware ($94,914, a difference of 0.12%), Immigrants from Ghana ($94,982, a difference of 0.19%), and Malaysian ($94,517, a difference of 0.30%).
| Demographics | Rating | Rank | Householder Income Ages 45 - 64 years |
| Panamanians | 10.6 /100 | #214 | Poor $96,066 |
| Nigerians | 8.2 /100 | #215 | Tragic $95,492 |
| Immigrants | Venezuela | 7.6 /100 | #216 | Tragic $95,342 |
| Immigrants | Ghana | 6.4 /100 | #217 | Tragic $94,982 |
| Delaware | 6.2 /100 | #218 | Tragic $94,914 |
| Immigrants | Armenia | 6.1 /100 | #219 | Tragic $94,863 |
| Salvadorans | 6.0 /100 | #220 | Tragic $94,842 |
| Immigrants | Nigeria | 5.9 /100 | #221 | Tragic $94,804 |
| Malaysians | 5.2 /100 | #222 | Tragic $94,517 |
| Immigrants | Nonimmigrants | 5.0 /100 | #223 | Tragic $94,448 |
| Immigrants | Bosnia and Herzegovina | 4.6 /100 | #224 | Tragic $94,288 |
| Bermudans | 4.4 /100 | #225 | Tragic $94,197 |
| Immigrants | Azores | 4.3 /100 | #226 | Tragic $94,138 |
| Alaska Natives | 4.0 /100 | #227 | Tragic $93,991 |
| Immigrants | Panama | 3.7 /100 | #228 | Tragic $93,815 |