French vs Fijian Child Poverty Under the Age of 5

COMPARE

French
Race
Ancestry
AfghanAfricanAlaska NativeAlaskan AthabascanAlbanianAleutAlsatianAmericanApacheArabArapahoArgentineanArmenianAssyrian/Chaldean/SyriacAustralianAustrianBahamianBangladeshiBarbadianBasqueBelgianBelizeanBermudanBhutaneseBlackfeetBolivianBrazilianBritishBritish West IndianBulgarianBurmeseCajunCambodianCanadianCape VerdeanCarpatho RusynCelticCentral AmericanCentral American IndianCherokeeCheyenneChickasawChileanChineseChippewaChoctawColombianColvilleComancheCosta RicanCreeCreekCroatianCrowCubanCypriotCzechCzechoslovakianDanishDelawareDominicanDutchDutch West IndianEastern EuropeanEcuadorianEgyptianEnglishEstonianEthiopianEuropeanFilipinoFinnishFrenchFrench American IndianFrench CanadianGermanGerman RussianGhanaianGreekGuamanian/ChamorroGuatemalanGuyaneseHaitianHmongHonduranHopiHoumaHungarianIcelanderIndian (Asian)IndonesianInupiatIranianIraqiIrishIroquoisIsraeliItalianJamaicanJapaneseJordanianKenyanKiowaKoreanLaotianLatvianLebaneseLiberianLithuanianLumbeeLuxembourgerMacedonianMalaysianMalteseMarshalleseMenomineeMexicanMexican American IndianMongolianMoroccanNative HawaiianNavajoNepaleseNew ZealanderNicaraguanNigerianNorthern EuropeanNorwegianOkinawanOsageOttawaPaiutePakistaniPalestinianPanamanianParaguayanPennsylvania GermanPeruvianPimaPolishPortuguesePotawatomiPuebloPuerto RicanPuget Sound SalishRomanianRussianSalvadoranSamoanScandinavianScotch-IrishScottishSeminoleSenegaleseSerbianShoshoneSierra LeoneanSiouxSlavicSlovakSloveneSomaliSouth AfricanSouth AmericanSouth American IndianSoviet UnionSpaniardSpanishSpanish AmericanSpanish American IndianSri LankanSubsaharan AfricanSudaneseSwedishSwissSyrianTaiwaneseThaiTlingit-HaidaTohono O'OdhamTonganTrinidadian and TobagonianTsimshianTurkishU.S. Virgin IslanderUgandanUkrainianUruguayanUteVenezuelanVietnameseWelshWest IndianYakamaYaquiYugoslavianYumanYup'ikZimbabwean
Immigration
NonimmigrantsImmigrantsAfghanistanAfricaAlbaniaArgentinaArmeniaAsiaAustraliaAustriaBahamasBangladeshBarbadosBelarusBelgiumBelizeBoliviaBosnia and HerzegovinaBrazilBulgariaBurma/MyanmarCabo VerdeCambodiaCameroonCanadaCaribbeanCentral AmericaChileChinaColombiaCongoCosta RicaCroatiaCubaCzechoslovakiaDenmarkDominicaDominican RepublicEastern AfricaEastern AsiaEastern EuropeEcuadorEgyptEl SalvadorEnglandEritreaEthiopiaEuropeFijiFranceGermanyGhanaGreeceGrenadaGuatemalaGuyanaHaitiHondurasHong KongHungaryIndiaIndonesiaIranIraqIrelandIsraelItalyJamaicaJapanJordanKazakhstanKenyaKoreaKuwaitLaosLatin AmericaLatviaLebanonLiberiaLithuaniaMalaysiaMexicoMicronesiaMiddle AfricaMoldovaMoroccoNepalNetherlandsNicaraguaNigeriaNorth AmericaNorth MacedoniaNorthern AfricaNorthern EuropeNorwayOceaniaPakistanPanamaPeruPhilippinesPolandPortugalRomaniaRussiaSaudi ArabiaScotlandSenegalSerbiaSierra LeoneSingaporeSomaliaSouth AfricaSouth AmericaSouth Central AsiaSouth Eastern AsiaSouthern EuropeSpainSri LankaSt. Vincent and the GrenadinesSudanSwedenSwitzerlandSyriaTaiwanThailandTrinidad and TobagoTurkeyUgandaUkraineUruguayUzbekistanVenezuelaVietnamWest IndiesWestern AfricaWestern AsiaWestern EuropeYemenZaireZimbabweAzores
Fijian
Race
Ancestry
AfghanAfricanAlaska NativeAlaskan AthabascanAlbanianAleutAlsatianAmericanApacheArabArapahoArgentineanArmenianAssyrian/Chaldean/SyriacAustralianAustrianBahamianBangladeshiBarbadianBasqueBelgianBelizeanBermudanBhutaneseBlackfeetBolivianBrazilianBritishBritish West IndianBulgarianBurmeseCajunCambodianCanadianCape VerdeanCarpatho RusynCelticCentral AmericanCentral American IndianCherokeeCheyenneChickasawChileanChineseChippewaChoctawColombianColvilleComancheCosta RicanCreeCreekCroatianCrowCubanCypriotCzechCzechoslovakianDanishDelawareDominicanDutchDutch West IndianEastern EuropeanEcuadorianEgyptianEnglishEstonianEthiopianEuropeanFijianFilipinoFinnishFrench American IndianFrench CanadianGermanGerman RussianGhanaianGreekGuamanian/ChamorroGuatemalanGuyaneseHaitianHmongHonduranHopiHoumaHungarianIcelanderIndian (Asian)IndonesianInupiatIranianIraqiIrishIroquoisIsraeliItalianJamaicanJapaneseJordanianKenyanKiowaKoreanLaotianLatvianLebaneseLiberianLithuanianLumbeeLuxembourgerMacedonianMalaysianMalteseMarshalleseMenomineeMexicanMexican American IndianMongolianMoroccanNative HawaiianNavajoNepaleseNew ZealanderNicaraguanNigerianNorthern EuropeanNorwegianOkinawanOsageOttawaPaiutePakistaniPalestinianPanamanianParaguayanPennsylvania GermanPeruvianPimaPolishPortuguesePotawatomiPuebloPuerto RicanPuget Sound SalishRomanianRussianSalvadoranSamoanScandinavianScotch-IrishScottishSeminoleSenegaleseSerbianShoshoneSierra LeoneanSiouxSlavicSlovakSloveneSomaliSouth AfricanSouth AmericanSouth American IndianSoviet UnionSpaniardSpanishSpanish AmericanSpanish American IndianSri LankanSubsaharan AfricanSudaneseSwedishSwissSyrianTaiwaneseThaiTlingit-HaidaTohono O'OdhamTonganTrinidadian and TobagonianTsimshianTurkishU.S. Virgin IslanderUgandanUkrainianUruguayanUteVenezuelanVietnameseWelshWest IndianYakamaYaquiYugoslavianYumanYup'ikZimbabwean
Immigration
NonimmigrantsImmigrantsAfghanistanAfricaAlbaniaArgentinaArmeniaAsiaAustraliaAustriaBahamasBangladeshBarbadosBelarusBelgiumBelizeBoliviaBosnia and HerzegovinaBrazilBulgariaBurma/MyanmarCabo VerdeCambodiaCameroonCanadaCaribbeanCentral AmericaChileChinaColombiaCongoCosta RicaCroatiaCubaCzechoslovakiaDenmarkDominicaDominican RepublicEastern AfricaEastern AsiaEastern EuropeEcuadorEgyptEl SalvadorEnglandEritreaEthiopiaEuropeFijiFranceGermanyGhanaGreeceGrenadaGuatemalaGuyanaHaitiHondurasHong KongHungaryIndiaIndonesiaIranIraqIrelandIsraelItalyJamaicaJapanJordanKazakhstanKenyaKoreaKuwaitLaosLatin AmericaLatviaLebanonLiberiaLithuaniaMalaysiaMexicoMicronesiaMiddle AfricaMoldovaMoroccoNepalNetherlandsNicaraguaNigeriaNorth AmericaNorth MacedoniaNorthern AfricaNorthern EuropeNorwayOceaniaPakistanPanamaPeruPhilippinesPolandPortugalRomaniaRussiaSaudi ArabiaScotlandSenegalSerbiaSierra LeoneSingaporeSomaliaSouth AfricaSouth AmericaSouth Central AsiaSouth Eastern AsiaSouthern EuropeSpainSri LankaSt. Vincent and the GrenadinesSudanSwedenSwitzerlandSyriaTaiwanThailandTrinidad and TobagoTurkeyUgandaUkraineUruguayUzbekistanVenezuelaVietnamWest IndiesWestern AfricaWestern AsiaWestern EuropeYemenZaireZimbabweAzores
Child Poverty Under the Age of 5
Income
Poverty
Unemployment
Labor Participation
Family Structure
Vehicle Availability
Education Level
Disability

Child Poverty Under the Age of 5 Comparison

French

Fijians

Fair
Tragic
17.5%
CHILD POVERTY UNDER THE AGE OF 5
33.6/ 100
METRIC RATING
189th/ 347
METRIC RANK
19.9%
CHILD POVERTY UNDER THE AGE OF 5
0.3/ 100
METRIC RATING
254th/ 347
METRIC RANK

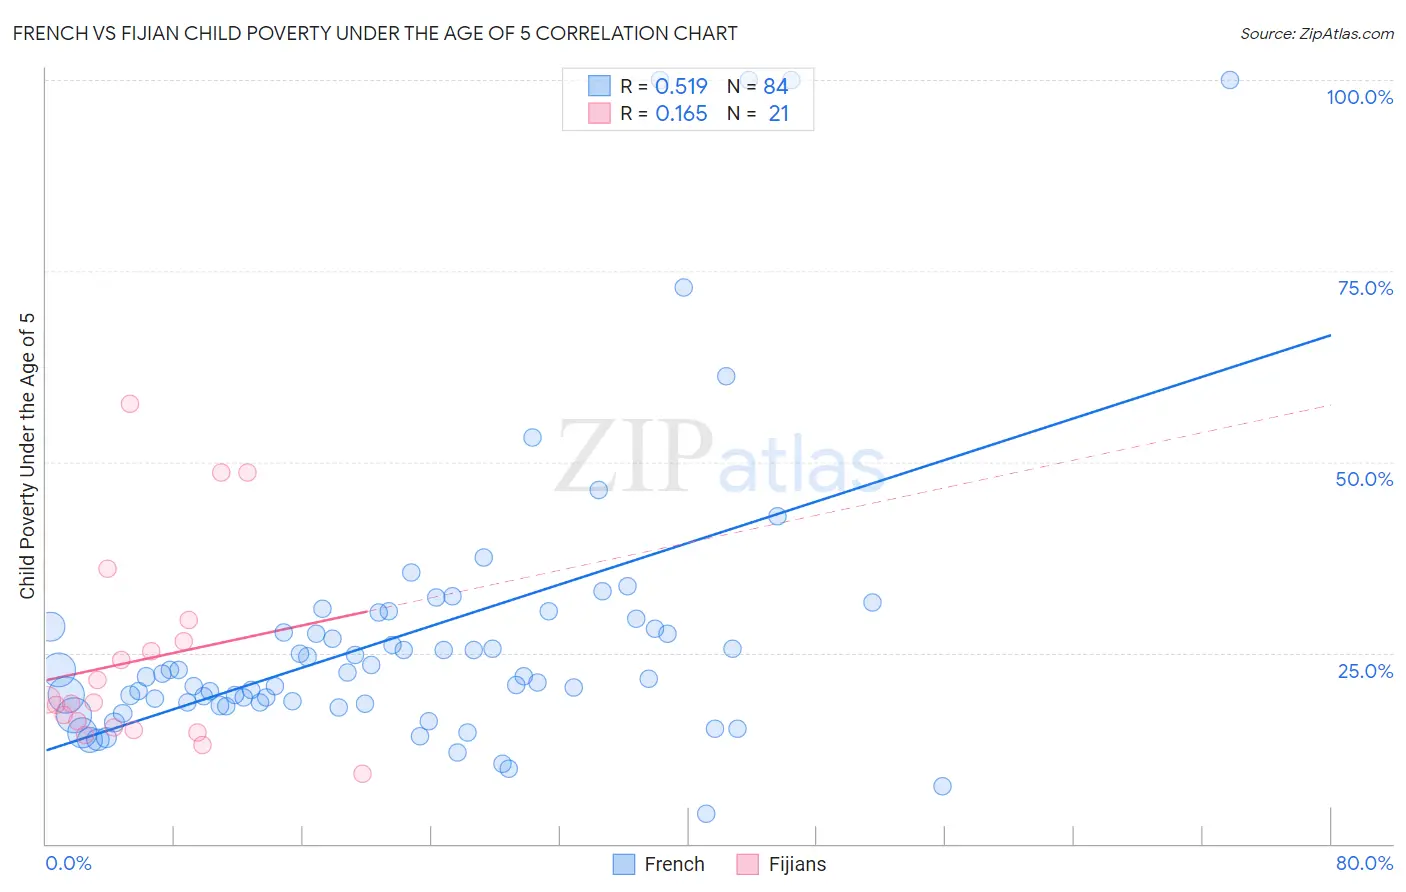
French vs Fijian Child Poverty Under the Age of 5 Correlation Chart

The statistical analysis conducted on geographies consisting of 531,494,079 people shows a substantial positive correlation between the proportion of French and poverty level among children under the age of 5 in the United States with a correlation coefficient (R) of 0.519 and weighted average of 17.5%. Similarly, the statistical analysis conducted on geographies consisting of 55,648,534 people shows a poor positive correlation between the proportion of Fijians and poverty level among children under the age of 5 in the United States with a correlation coefficient (R) of 0.165 and weighted average of 19.9%, a difference of 13.5%.
French vs Fijian Child Poverty Under the Age of 5

Child Poverty Under the Age of 5 Correlation Summary

MeasurementFrenchFijian
Minimum4.0%9.1%
Maximum100.0%57.7%
Range96.0%48.6%
Mean27.5%24.1%
Median22.1%18.5%
Interquartile 25% (IQ1)18.4%15.1%
Interquartile 75% (IQ3)28.9%27.9%
Interquartile Range (IQR)10.5%12.8%
Standard Deviation (Sample)19.4%13.1%
Standard Deviation (Population)19.3%12.8%

Similar Demographics by Child Poverty Under the Age of 5

Demographics Similar to French by Child Poverty Under the Age of 5

In terms of child poverty under the age of 5, the demographic groups most similar to French are Carpatho Rusyn (17.5%, a difference of 0.010%), Kenyan (17.5%, a difference of 0.12%), Immigrants from Bosnia and Herzegovina (17.5%, a difference of 0.16%), Immigrants from Armenia (17.5%, a difference of 0.49%), and Slovak (17.6%, a difference of 0.52%).
DemographicsRating | RankChild Poverty Under the Age of 5
Arabs
40.7
/100
|
#182
Average
17.4%
Lebanese
40.3
/100
|
#183
Average
17.4%
Immigrants | Costa Rica
39.0
/100
|
#184
Fair
17.4%
Immigrants | Armenia
38.0
/100
|
#185
Fair
17.5%
Immigrants | Bosnia and Herzegovina
35.0
/100
|
#186
Fair
17.5%
Kenyans
34.7
/100
|
#187
Fair
17.5%
Carpatho Rusyns
33.6
/100
|
#188
Fair
17.5%
French
33.6
/100
|
#189
Fair
17.5%
Slovaks
29.2
/100
|
#190
Fair
17.6%
Immigrants | Afghanistan
27.9
/100
|
#191
Fair
17.7%
Immigrants | Uruguay
27.8
/100
|
#192
Fair
17.7%
Immigrants | Uganda
25.0
/100
|
#193
Fair
17.7%
French Canadians
24.6
/100
|
#194
Fair
17.7%
Sierra Leoneans
24.1
/100
|
#195
Fair
17.7%
Immigrants | Portugal
22.2
/100
|
#196
Fair
17.8%

Demographics Similar to Fijians by Child Poverty Under the Age of 5

In terms of child poverty under the age of 5, the demographic groups most similar to Fijians are Immigrants from Cuba (19.9%, a difference of 0.10%), Mexican American Indian (19.9%, a difference of 0.15%), Immigrants from Barbados (20.0%, a difference of 0.32%), Shoshone (20.0%, a difference of 0.33%), and Immigrants from St. Vincent and the Grenadines (20.0%, a difference of 0.47%).
DemographicsRating | RankChild Poverty Under the Age of 5
Guyanese
0.4
/100
|
#247
Tragic
19.7%
Marshallese
0.4
/100
|
#248
Tragic
19.7%
Immigrants | Middle Africa
0.4
/100
|
#249
Tragic
19.7%
Immigrants | Nonimmigrants
0.4
/100
|
#250
Tragic
19.7%
Pennsylvania Germans
0.3
/100
|
#251
Tragic
19.8%
Immigrants | Nicaragua
0.3
/100
|
#252
Tragic
19.8%
Mexican American Indians
0.3
/100
|
#253
Tragic
19.9%
Fijians
0.3
/100
|
#254
Tragic
19.9%
Immigrants | Cuba
0.2
/100
|
#255
Tragic
19.9%
Immigrants | Barbados
0.2
/100
|
#256
Tragic
20.0%
Shoshone
0.2
/100
|
#257
Tragic
20.0%
Immigrants | St. Vincent and the Grenadines
0.2
/100
|
#258
Tragic
20.0%
Immigrants | El Salvador
0.2
/100
|
#259
Tragic
20.0%
Spanish Americans
0.2
/100
|
#260
Tragic
20.1%
Immigrants | Bangladesh
0.2
/100
|
#261
Tragic
20.1%