Immigrants from Morocco vs Fijian Child Poverty Under the Age of 5
COMPARE
Immigrants from Morocco
Fijian
Child Poverty Under the Age of 5
Child Poverty Under the Age of 5 Comparison
Immigrants from Morocco
Fijians
17.1%
CHILD POVERTY UNDER THE AGE OF 5
58.9/ 100
METRIC RATING
171st/ 347
METRIC RANK
19.9%
CHILD POVERTY UNDER THE AGE OF 5
0.3/ 100
METRIC RATING
254th/ 347
METRIC RANK
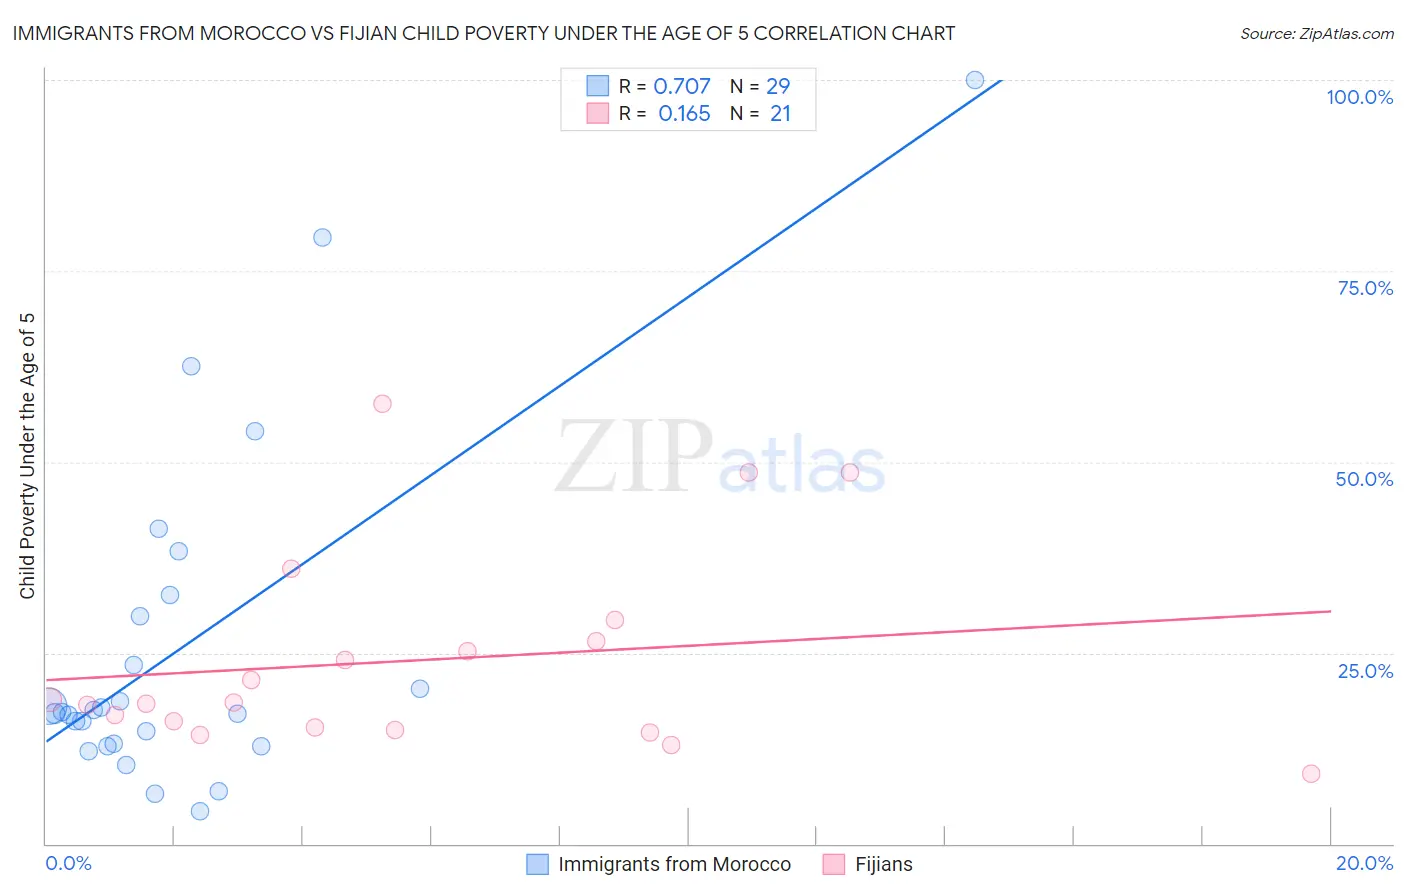
Immigrants from Morocco vs Fijian Child Poverty Under the Age of 5 Correlation Chart
The statistical analysis conducted on geographies consisting of 175,526,639 people shows a strong positive correlation between the proportion of Immigrants from Morocco and poverty level among children under the age of 5 in the United States with a correlation coefficient (R) of 0.707 and weighted average of 17.1%. Similarly, the statistical analysis conducted on geographies consisting of 55,648,534 people shows a poor positive correlation between the proportion of Fijians and poverty level among children under the age of 5 in the United States with a correlation coefficient (R) of 0.165 and weighted average of 19.9%, a difference of 16.6%.
Child Poverty Under the Age of 5 Correlation Summary
| Measurement | Immigrants from Morocco | Fijian |
| Minimum | 4.3% | 9.1% |
| Maximum | 100.0% | 57.7% |
| Range | 95.7% | 48.6% |
| Mean | 25.8% | 24.1% |
| Median | 17.2% | 18.5% |
| Interquartile 25% (IQ1) | 13.0% | 15.1% |
| Interquartile 75% (IQ3) | 31.2% | 27.9% |
| Interquartile Range (IQR) | 18.2% | 12.8% |
| Standard Deviation (Sample) | 22.4% | 13.1% |
| Standard Deviation (Population) | 22.0% | 12.8% |
Similar Demographics by Child Poverty Under the Age of 5
Demographics Similar to Immigrants from Morocco by Child Poverty Under the Age of 5
In terms of child poverty under the age of 5, the demographic groups most similar to Immigrants from Morocco are Immigrants from Western Asia (17.1%, a difference of 0.030%), Immigrants from South America (17.1%, a difference of 0.12%), Uruguayan (17.0%, a difference of 0.17%), Immigrants from Uzbekistan (17.0%, a difference of 0.33%), and Yugoslavian (17.2%, a difference of 0.51%).
| Demographics | Rating | Rank | Child Poverty Under the Age of 5 |
| Immigrants | Oceania | 67.6 /100 | #164 | Good 16.9% |
| Immigrants | Colombia | 66.9 /100 | #165 | Good 16.9% |
| Slavs | 64.0 /100 | #166 | Good 17.0% |
| Immigrants | Uzbekistan | 62.0 /100 | #167 | Good 17.0% |
| Uruguayans | 60.5 /100 | #168 | Good 17.0% |
| Immigrants | South America | 60.0 /100 | #169 | Good 17.1% |
| Immigrants | Western Asia | 59.2 /100 | #170 | Average 17.1% |
| Immigrants | Morocco | 58.9 /100 | #171 | Average 17.1% |
| Yugoslavians | 54.1 /100 | #172 | Average 17.2% |
| Welsh | 54.0 /100 | #173 | Average 17.2% |
| Immigrants | Saudi Arabia | 50.0 /100 | #174 | Average 17.2% |
| Immigrants | Lebanon | 47.6 /100 | #175 | Average 17.3% |
| Immigrants | Iraq | 45.2 /100 | #176 | Average 17.3% |
| Immigrants | Sierra Leone | 43.6 /100 | #177 | Average 17.3% |
| Immigrants | Cameroon | 42.7 /100 | #178 | Average 17.4% |
Demographics Similar to Fijians by Child Poverty Under the Age of 5
In terms of child poverty under the age of 5, the demographic groups most similar to Fijians are Immigrants from Cuba (19.9%, a difference of 0.10%), Mexican American Indian (19.9%, a difference of 0.15%), Immigrants from Barbados (20.0%, a difference of 0.32%), Shoshone (20.0%, a difference of 0.33%), and Immigrants from St. Vincent and the Grenadines (20.0%, a difference of 0.47%).
| Demographics | Rating | Rank | Child Poverty Under the Age of 5 |
| Guyanese | 0.4 /100 | #247 | Tragic 19.7% |
| Marshallese | 0.4 /100 | #248 | Tragic 19.7% |
| Immigrants | Middle Africa | 0.4 /100 | #249 | Tragic 19.7% |
| Immigrants | Nonimmigrants | 0.4 /100 | #250 | Tragic 19.7% |
| Pennsylvania Germans | 0.3 /100 | #251 | Tragic 19.8% |
| Immigrants | Nicaragua | 0.3 /100 | #252 | Tragic 19.8% |
| Mexican American Indians | 0.3 /100 | #253 | Tragic 19.9% |
| Fijians | 0.3 /100 | #254 | Tragic 19.9% |
| Immigrants | Cuba | 0.2 /100 | #255 | Tragic 19.9% |
| Immigrants | Barbados | 0.2 /100 | #256 | Tragic 20.0% |
| Shoshone | 0.2 /100 | #257 | Tragic 20.0% |
| Immigrants | St. Vincent and the Grenadines | 0.2 /100 | #258 | Tragic 20.0% |
| Immigrants | El Salvador | 0.2 /100 | #259 | Tragic 20.0% |
| Spanish Americans | 0.2 /100 | #260 | Tragic 20.1% |
| Immigrants | Bangladesh | 0.2 /100 | #261 | Tragic 20.1% |