Subsaharan African vs Immigrants from Dominica Receiving Food Stamps
COMPARE
Subsaharan African
Immigrants from Dominica
Receiving Food Stamps
Receiving Food Stamps Comparison
Sub-Saharan Africans
Immigrants from Dominica
14.1%
RECEIVING FOOD STAMPS
0.3/ 100
METRIC RATING
255th/ 347
METRIC RANK
18.4%
RECEIVING FOOD STAMPS
0.0/ 100
METRIC RATING
329th/ 347
METRIC RANK
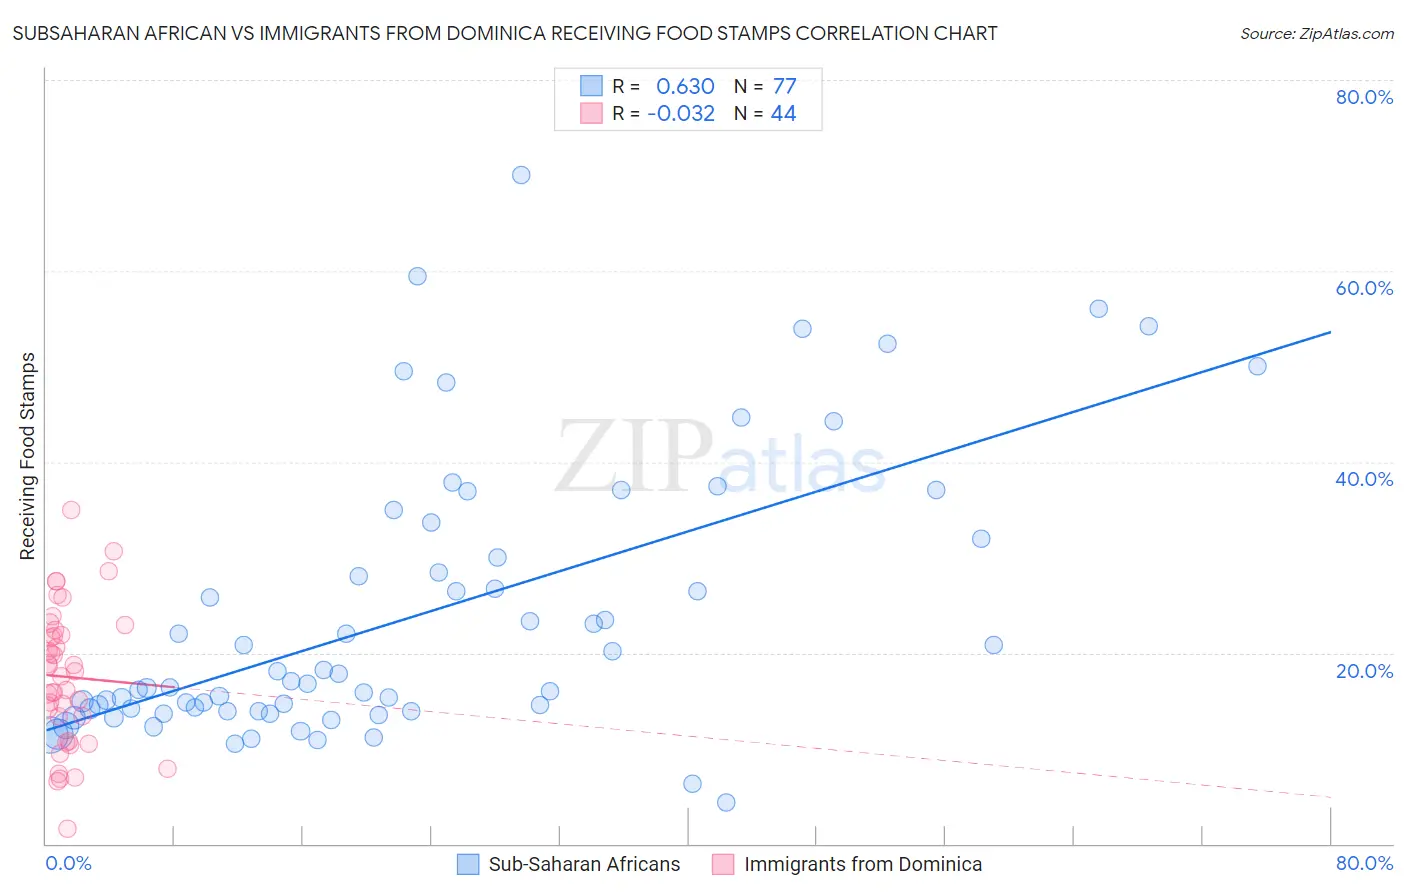
Subsaharan African vs Immigrants from Dominica Receiving Food Stamps Correlation Chart
The statistical analysis conducted on geographies consisting of 506,389,803 people shows a significant positive correlation between the proportion of Sub-Saharan Africans and percentage of population receiving government assistance and/or food stamps in the United States with a correlation coefficient (R) of 0.630 and weighted average of 14.1%. Similarly, the statistical analysis conducted on geographies consisting of 83,761,752 people shows no correlation between the proportion of Immigrants from Dominica and percentage of population receiving government assistance and/or food stamps in the United States with a correlation coefficient (R) of -0.032 and weighted average of 18.4%, a difference of 30.6%.
Receiving Food Stamps Correlation Summary
| Measurement | Subsaharan African | Immigrants from Dominica |
| Minimum | 4.3% | 1.6% |
| Maximum | 70.0% | 35.0% |
| Range | 65.7% | 33.4% |
| Mean | 23.8% | 17.5% |
| Median | 16.8% | 17.8% |
| Interquartile 25% (IQ1) | 13.9% | 12.1% |
| Interquartile 75% (IQ3) | 31.0% | 22.1% |
| Interquartile Range (IQR) | 17.1% | 10.0% |
| Standard Deviation (Sample) | 14.4% | 7.3% |
| Standard Deviation (Population) | 14.3% | 7.2% |
Similar Demographics by Receiving Food Stamps
Demographics Similar to Sub-Saharan Africans by Receiving Food Stamps
In terms of receiving food stamps, the demographic groups most similar to Sub-Saharan Africans are Marshallese (14.1%, a difference of 0.010%), Japanese (14.1%, a difference of 0.020%), Arapaho (14.1%, a difference of 0.12%), Immigrants from Ghana (14.1%, a difference of 0.20%), and Creek (14.1%, a difference of 0.33%).
| Demographics | Rating | Rank | Receiving Food Stamps |
| Immigrants | Laos | 0.7 /100 | #248 | Tragic 13.8% |
| Indonesians | 0.6 /100 | #249 | Tragic 13.9% |
| Immigrants | Cambodia | 0.5 /100 | #250 | Tragic 13.9% |
| Yaqui | 0.5 /100 | #251 | Tragic 13.9% |
| Ghanaians | 0.5 /100 | #252 | Tragic 14.0% |
| Spanish Americans | 0.4 /100 | #253 | Tragic 14.0% |
| Marshallese | 0.3 /100 | #254 | Tragic 14.1% |
| Sub-Saharan Africans | 0.3 /100 | #255 | Tragic 14.1% |
| Japanese | 0.3 /100 | #256 | Tragic 14.1% |
| Arapaho | 0.3 /100 | #257 | Tragic 14.1% |
| Immigrants | Ghana | 0.3 /100 | #258 | Tragic 14.1% |
| Creek | 0.3 /100 | #259 | Tragic 14.1% |
| Central Americans | 0.3 /100 | #260 | Tragic 14.1% |
| Immigrants | Congo | 0.3 /100 | #261 | Tragic 14.1% |
| Paiute | 0.2 /100 | #262 | Tragic 14.3% |
Demographics Similar to Immigrants from Dominica by Receiving Food Stamps
In terms of receiving food stamps, the demographic groups most similar to Immigrants from Dominica are Colville (18.3%, a difference of 0.46%), Apache (18.3%, a difference of 0.67%), Cuban (18.2%, a difference of 0.98%), Immigrants from Haiti (18.2%, a difference of 1.1%), and British West Indian (17.9%, a difference of 2.9%).
| Demographics | Rating | Rank | Receiving Food Stamps |
| Immigrants | Grenada | 0.0 /100 | #322 | Tragic 17.8% |
| Haitians | 0.0 /100 | #323 | Tragic 17.8% |
| British West Indians | 0.0 /100 | #324 | Tragic 17.9% |
| Immigrants | Haiti | 0.0 /100 | #325 | Tragic 18.2% |
| Cubans | 0.0 /100 | #326 | Tragic 18.2% |
| Apache | 0.0 /100 | #327 | Tragic 18.3% |
| Colville | 0.0 /100 | #328 | Tragic 18.3% |
| Immigrants | Dominica | 0.0 /100 | #329 | Tragic 18.4% |
| Pima | 0.0 /100 | #330 | Tragic 19.0% |
| Immigrants | Caribbean | 0.0 /100 | #331 | Tragic 19.6% |
| Pueblo | 0.0 /100 | #332 | Tragic 19.9% |
| Inupiat | 0.0 /100 | #333 | Tragic 20.1% |
| Yuman | 0.0 /100 | #334 | Tragic 20.2% |
| Immigrants | Cuba | 0.0 /100 | #335 | Tragic 20.8% |
| Navajo | 0.0 /100 | #336 | Tragic 21.1% |