Samoan vs Immigrants from Dominica Female Poverty Among 18-24 Year Olds
COMPARE
Samoan
Immigrants from Dominica
Female Poverty Among 18-24 Year Olds
Female Poverty Among 18-24 Year Olds Comparison
Samoans
Immigrants from Dominica
18.2%
FEMALE POVERTY AMONG 18-24 YEAR OLDS
100.0/ 100
METRIC RATING
50th/ 347
METRIC RANK
21.9%
FEMALE POVERTY AMONG 18-24 YEAR OLDS
0.1/ 100
METRIC RATING
280th/ 347
METRIC RANK
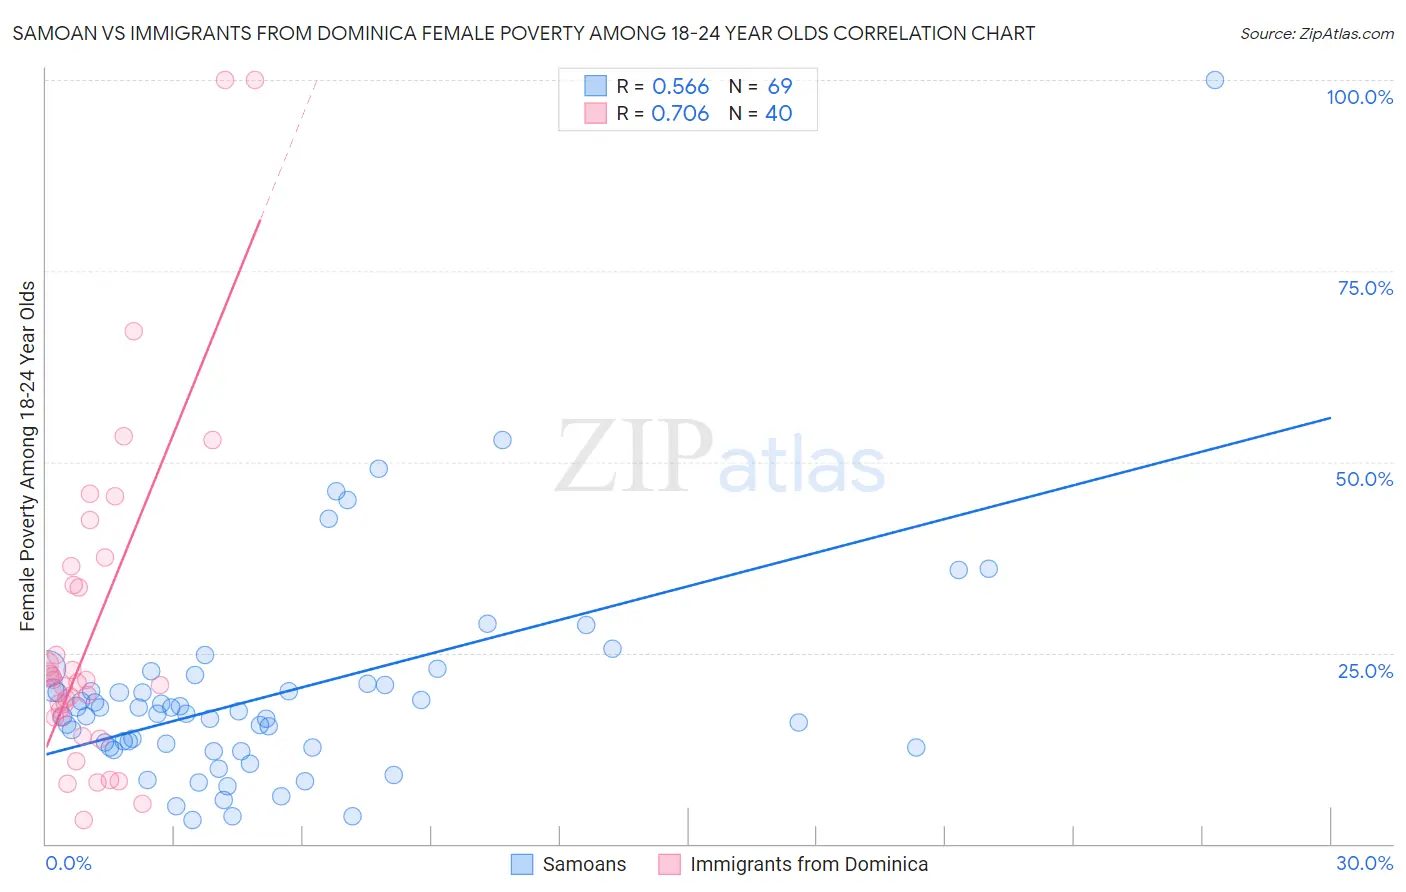
Samoan vs Immigrants from Dominica Female Poverty Among 18-24 Year Olds Correlation Chart
The statistical analysis conducted on geographies consisting of 223,050,884 people shows a substantial positive correlation between the proportion of Samoans and poverty level among females between the ages 18 and 24 in the United States with a correlation coefficient (R) of 0.566 and weighted average of 18.2%. Similarly, the statistical analysis conducted on geographies consisting of 83,465,633 people shows a strong positive correlation between the proportion of Immigrants from Dominica and poverty level among females between the ages 18 and 24 in the United States with a correlation coefficient (R) of 0.706 and weighted average of 21.9%, a difference of 20.3%.
Female Poverty Among 18-24 Year Olds Correlation Summary
| Measurement | Samoan | Immigrants from Dominica |
| Minimum | 3.1% | 3.1% |
| Maximum | 100.0% | 100.0% |
| Range | 96.9% | 96.9% |
| Mean | 19.6% | 27.9% |
| Median | 17.1% | 21.3% |
| Interquartile 25% (IQ1) | 12.6% | 16.5% |
| Interquartile 75% (IQ3) | 20.9% | 35.0% |
| Interquartile Range (IQR) | 8.3% | 18.6% |
| Standard Deviation (Sample) | 14.3% | 22.0% |
| Standard Deviation (Population) | 14.2% | 21.7% |
Similar Demographics by Female Poverty Among 18-24 Year Olds
Demographics Similar to Samoans by Female Poverty Among 18-24 Year Olds
In terms of female poverty among 18-24 year olds, the demographic groups most similar to Samoans are Bhutanese (18.2%, a difference of 0.11%), Sri Lankan (18.2%, a difference of 0.14%), Immigrants from Eastern Europe (18.2%, a difference of 0.17%), Asian (18.2%, a difference of 0.19%), and Immigrants from Southern Europe (18.2%, a difference of 0.27%).
| Demographics | Rating | Rank | Female Poverty Among 18-24 Year Olds |
| Macedonians | 100.0 /100 | #43 | Exceptional 18.1% |
| Nicaraguans | 100.0 /100 | #44 | Exceptional 18.1% |
| Spanish American Indians | 100.0 /100 | #45 | Exceptional 18.1% |
| Immigrants | Southern Europe | 100.0 /100 | #46 | Exceptional 18.2% |
| Asians | 100.0 /100 | #47 | Exceptional 18.2% |
| Sri Lankans | 100.0 /100 | #48 | Exceptional 18.2% |
| Bhutanese | 100.0 /100 | #49 | Exceptional 18.2% |
| Samoans | 100.0 /100 | #50 | Exceptional 18.2% |
| Immigrants | Eastern Europe | 99.9 /100 | #51 | Exceptional 18.2% |
| Immigrants | Ireland | 99.9 /100 | #52 | Exceptional 18.3% |
| Italians | 99.9 /100 | #53 | Exceptional 18.3% |
| Immigrants | Egypt | 99.9 /100 | #54 | Exceptional 18.4% |
| Albanians | 99.9 /100 | #55 | Exceptional 18.4% |
| Argentineans | 99.9 /100 | #56 | Exceptional 18.4% |
| Immigrants | Italy | 99.9 /100 | #57 | Exceptional 18.4% |
Demographics Similar to Immigrants from Dominica by Female Poverty Among 18-24 Year Olds
In terms of female poverty among 18-24 year olds, the demographic groups most similar to Immigrants from Dominica are Spanish American (21.9%, a difference of 0.010%), Immigrants from Dominican Republic (21.9%, a difference of 0.040%), Bermudan (21.9%, a difference of 0.13%), Yaqui (21.9%, a difference of 0.18%), and Subsaharan African (22.0%, a difference of 0.43%).
| Demographics | Rating | Rank | Female Poverty Among 18-24 Year Olds |
| New Zealanders | 0.2 /100 | #273 | Tragic 21.7% |
| Immigrants | Honduras | 0.1 /100 | #274 | Tragic 21.8% |
| Immigrants | Bangladesh | 0.1 /100 | #275 | Tragic 21.8% |
| Bahamians | 0.1 /100 | #276 | Tragic 21.8% |
| Immigrants | Switzerland | 0.1 /100 | #277 | Tragic 21.8% |
| Yaqui | 0.1 /100 | #278 | Tragic 21.9% |
| Spanish Americans | 0.1 /100 | #279 | Tragic 21.9% |
| Immigrants | Dominica | 0.1 /100 | #280 | Tragic 21.9% |
| Immigrants | Dominican Republic | 0.1 /100 | #281 | Tragic 21.9% |
| Bermudans | 0.1 /100 | #282 | Tragic 21.9% |
| Sub-Saharan Africans | 0.0 /100 | #283 | Tragic 22.0% |
| Tlingit-Haida | 0.0 /100 | #284 | Tragic 22.0% |
| Ottawa | 0.0 /100 | #285 | Tragic 22.0% |
| Ugandans | 0.0 /100 | #286 | Tragic 22.1% |
| Immigrants | Middle Africa | 0.0 /100 | #287 | Tragic 22.1% |