Immigrants from Guyana vs Immigrants from Dominica Receiving Food Stamps
COMPARE
Immigrants from Guyana
Immigrants from Dominica
Receiving Food Stamps
Receiving Food Stamps Comparison
Immigrants from Guyana
Immigrants from Dominica
16.9%
RECEIVING FOOD STAMPS
0.0/ 100
METRIC RATING
314th/ 347
METRIC RANK
18.4%
RECEIVING FOOD STAMPS
0.0/ 100
METRIC RATING
329th/ 347
METRIC RANK
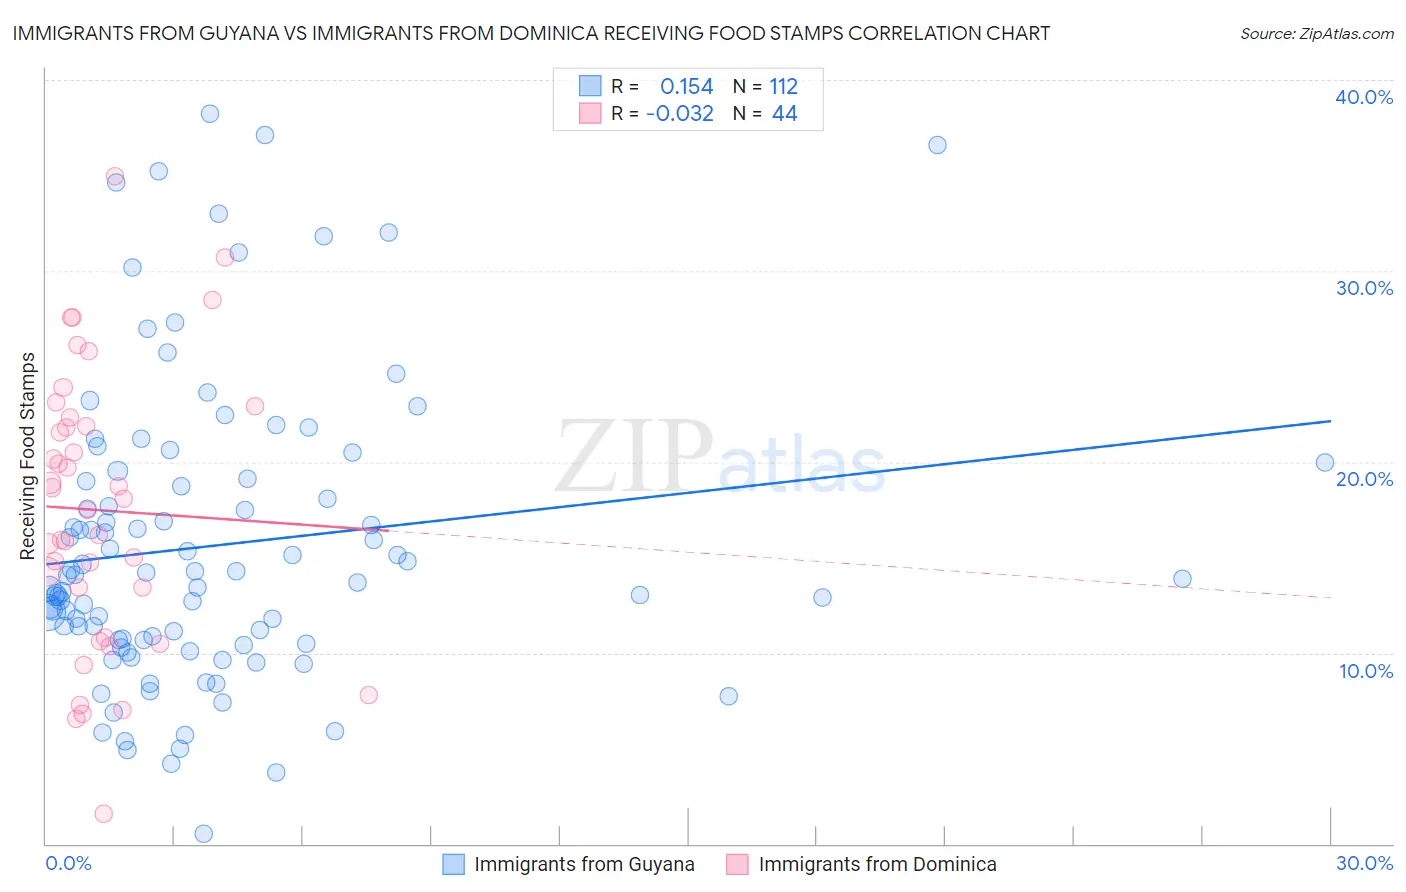
Immigrants from Guyana vs Immigrants from Dominica Receiving Food Stamps Correlation Chart
The statistical analysis conducted on geographies consisting of 183,583,231 people shows a poor positive correlation between the proportion of Immigrants from Guyana and percentage of population receiving government assistance and/or food stamps in the United States with a correlation coefficient (R) of 0.154 and weighted average of 16.9%. Similarly, the statistical analysis conducted on geographies consisting of 83,761,752 people shows no correlation between the proportion of Immigrants from Dominica and percentage of population receiving government assistance and/or food stamps in the United States with a correlation coefficient (R) of -0.032 and weighted average of 18.4%, a difference of 8.9%.
Receiving Food Stamps Correlation Summary
| Measurement | Immigrants from Guyana | Immigrants from Dominica |
| Minimum | 0.50% | 1.6% |
| Maximum | 38.2% | 35.0% |
| Range | 37.7% | 33.4% |
| Mean | 15.6% | 17.5% |
| Median | 14.0% | 17.8% |
| Interquartile 25% (IQ1) | 10.7% | 12.1% |
| Interquartile 75% (IQ3) | 19.1% | 22.1% |
| Interquartile Range (IQR) | 8.4% | 10.0% |
| Standard Deviation (Sample) | 7.8% | 7.3% |
| Standard Deviation (Population) | 7.7% | 7.2% |
Demographics Similar to Immigrants from Guyana and Immigrants from Dominica by Receiving Food Stamps
In terms of receiving food stamps, the demographic groups most similar to Immigrants from Guyana are Immigrants from Jamaica (16.9%, a difference of 0.17%), Sioux (16.8%, a difference of 0.45%), Bahamian (17.0%, a difference of 0.57%), Central American Indian (17.1%, a difference of 1.0%), and Guyanese (16.7%, a difference of 1.2%). Similarly, the demographic groups most similar to Immigrants from Dominica are Colville (18.3%, a difference of 0.46%), Apache (18.3%, a difference of 0.67%), Cuban (18.2%, a difference of 0.98%), Immigrants from Haiti (18.2%, a difference of 1.1%), and British West Indian (17.9%, a difference of 2.9%).
| Demographics | Rating | Rank | Receiving Food Stamps |
| Guyanese | 0.0 /100 | #311 | Tragic 16.7% |
| Sioux | 0.0 /100 | #312 | Tragic 16.8% |
| Immigrants | Jamaica | 0.0 /100 | #313 | Tragic 16.9% |
| Immigrants | Guyana | 0.0 /100 | #314 | Tragic 16.9% |
| Bahamians | 0.0 /100 | #315 | Tragic 17.0% |
| Central American Indians | 0.0 /100 | #316 | Tragic 17.1% |
| Blacks/African Americans | 0.0 /100 | #317 | Tragic 17.2% |
| Menominee | 0.0 /100 | #318 | Tragic 17.2% |
| Immigrants | St. Vincent and the Grenadines | 0.0 /100 | #319 | Tragic 17.2% |
| Immigrants | Nicaragua | 0.0 /100 | #320 | Tragic 17.2% |
| Natives/Alaskans | 0.0 /100 | #321 | Tragic 17.3% |
| Immigrants | Grenada | 0.0 /100 | #322 | Tragic 17.8% |
| Haitians | 0.0 /100 | #323 | Tragic 17.8% |
| British West Indians | 0.0 /100 | #324 | Tragic 17.9% |
| Immigrants | Haiti | 0.0 /100 | #325 | Tragic 18.2% |
| Cubans | 0.0 /100 | #326 | Tragic 18.2% |
| Apache | 0.0 /100 | #327 | Tragic 18.3% |
| Colville | 0.0 /100 | #328 | Tragic 18.3% |
| Immigrants | Dominica | 0.0 /100 | #329 | Tragic 18.4% |
| Pima | 0.0 /100 | #330 | Tragic 19.0% |
| Immigrants | Caribbean | 0.0 /100 | #331 | Tragic 19.6% |